

Indo-Pacific Bottlenose Dolphin
Tursiops aduncus

2025 Red list
status
Natal Bioregion subpopulation

2025 Red list
status
Agulhas Bioregion subpopulation
Regional Population
Trend
Declining
Change compared
to 2016
No Change
Overview
Tursiops aduncus – (Ehrenberg, 1833)
ANIMALIA – CHORDATA – MAMMALIA – ARTIODACTYLA – DELPHINIDAE – Tursiops – aduncus
Common Names: Indo-Pacific Bottlenose Dolphin (English), Indian Ocean Bottlenose Dolphin (English), Indiese Oseaan-stompneusdolfyn (Afrikaans), Delfin Mular del Oceano Indico (Spanish; Castilian), Grand dauphin de l’Océan Indien (French)
Synonyms: Delphinus aduncus Ehrenberg, 1833 [1832]
Taxonomic Note:
The Indo-Pacific Bottlenose Dolphin (Tursiops aduncus) has been recognised as a different species from the more widely distributed Common Bottlenose Dolphin (Tursiops truncatus) since the late 1990’s (Rice, 1998). Indo-Pacific Bottlenose Dolphins are distinct from Common Bottlenose Dolphins based on concordance among genetic, osteology, coloration and external morphology data (Wang et al. 1999, 2000a,b). A recent re-assessment of Tursiops taxonomy worldwide (IWC 2019) and extensive genetic studies (Moura et al. 2013, 2020; Amaral et al. 2016; Gray et al. 2018) identified 4 or 5 different lineages (Africa, Pakistan, Bay of Bengal, China and Australia), including the recently described “T. australis” (Charlton-Robb et al. 2011) that may eventually be recognised as a subspecies. There is considerable population structure throughout the range of the species and multiple studies of morphology (Hale et al. 2000; Kemper 2004; Charlton-Robb et al. 2011; Gray et al. 2021) and genetics (Natoli et al. 2004; Särnblad et al. 2011; Charlton-Robb et al. 2011; Amaral et al. 2016; Vargas-Fonseca et al. 2021) indicate that the taxonomic status for a number of populations in different regions should be re-evaluated.
| Red List Status |
|
Natal Bioregion subpopulation – VU – Vulnerable C2a(ii) Agulhas Bioregion subpopulation – NT – Near Threatened B2ab(iii,v) (IUCN version 3.1) |
Assessment Information
Assessors: Vargas-Fonseca O.A.1,2, Probert, R.3, Hoelzel, R.4 & da Silva, J.5
Reviewer: Plön, S.3
Contributor: Patel, T.6
Institutions: 1Institute for Coastal and Marine Research, Nelson Mandela University, Gqeberha, South Africa, 2NVT, Nature’s Valley, South Africa, 3University of Cape Town, South Africa, 4Durham University, 5South African National Biodiversity Institute, 6Endangered Wildlife Trust
Previous Assessors: Cockcroft, V., Natoli, A., Reisinger, R., Elwen, S., Hoelzel, A.R., Atkins, S. Probert, R; Vargas-Fonseca O.A
Previous Reviewers: Plön, S. & Child, M.F.
Previous Contributors: Findlay, K., Meÿer, M. & Oosthuizen, H.
Assessment Rationale
While two subpopulations were assessed in the 2004 assessment (Friedmann & Daly 2004) – a migratory stock, moving between Plettenberg Bay and Durban and a so-called resident stock (nearshore waters less than 50 m depth from Kosi Bay to Mossel Bay) – subsequent molecular studies show significant differentiation between three putative subpopulations: northern and southern ‘resident’ subpopulations either side of Ifafa, KZN Province, and a third ‘migratory’ or transient subpopulation. Previous assessment labelled these subpopulations the Ifafa-Kosi Bay, Ifafa-False Bay and seasonal subpopulations, respectively. Vargas-Fonseca et al. (2021), using genomic data, confirmed two subpopulations, showing the strongest divergence between the Western Cape near Plettenberg Bay (Agulhas Bioregion) and populations in KZN (Port Edward to Richards Bay; Natal Bioregion). Along the Natal Bioregion a weaker boundary at Ifafa was confirmed, but the data suggested that the position of the boundary moved south towards the Eastern Cape during the sardine run season (~June-August). A higher spatial and temporal resolution will facilitate a better understanding of this system. Further north, significant differentiation between populations in South Africa and Zanzibar have been shown (Gray et al. 2021).
This species is threatened by habitat degradation and fragmentation, pollution from industrial and agricultural runoff, coastal development, vessel traffic, competition with fisheries and ongoing bycatch in shark nets and there is thus an inferred continuing decline in the population in some areas such as Plettenberg Bay (e.g., Vargas-Fonseca et al. 2020). The species prefers waters less than 30–50 m deep and only occurs within 10 km of the shoreline. Correspondingly, most of the population occurs within 500 m to 2 km of the coastline. For the Ifafa-Kosi Bay subpopulation (now Natal Bioregion subpopulation), the length of the coastline is 572 km. Therefore, the extent of occurrence (EOO) is estimated to be 5,720 km2 (using 10 km from shore as the limit), while the area of occupancy (AOO) is estimated to be 286–1,144 km2. Although almost meeting the requirements for Vulnerable B1ab(iii,v)+B2ab(iii,v), they are not known to be fragmented (though data north of Richards Bay are lacking), and the number of locations along the coast where the species is found is uncertain. There are probably fewer than 2,500 mature individuals in the subpopulation with all individuals being connected within the Agulhas or Natal Bioregion and thus the proportion of individuals in one subpopulation is likely to be 95–100%, which would qualify the subpopulation as Endangered C2a(ii). However, it is poorly understood whether the Mozambique population is part of the same subpopulation or distinct from the northern KZN animals, although Zanzibar is known to be distinct (Gray et al. 2021). If there were substantial dispersal between Mozambique and northern KZN, rescue effects would be possible. Thus, we list this subpopulation as Vulnerable C2a(ii).
The length of the coastline for the Agulhas Bioregion subpopulation (previously Ifafa to False Bay) is 2,080 km, with a genetic break thought to occur along the Eastern Cape, likely aligning with the boundary between the Agulhas and Natal bioregions (Vargas-Fonseca et al. 2021). The EOO is estimated to be 20,800 km2, while the AOO is 1,040–4,160 km2. Although almost meeting the requirements for Vulnerable B1ab(iii,v) +B2ab(iii,v), the population is not fragmented, and the number of locations is uncertain. The mature population size is estimated to be over 10,000 individuals. Thus, we list this subpopulation as Near Threatened B2ab(iii,v).
In the 2004 assessment, a so-called migratory stock—believed to move between Plettenberg Bay and Durban—was assessed separately from a resident stock occupying nearshore waters (less than 50 m depth) between Kosi Bay and Mossel Bay. This division was initially based on findings by Goodwin et al. (1996), who reported significant differentiation in mtDNA haplotypes between individuals from the Eastern Cape and KwaZulu-Natal (KZN). Later, Natoli et al. (2008) identified three putative genetic stocks, including a ‘migratory’ group and two resident populations on either side of Ifafa. However, the genetic variance among these groups was minimal, with none of the comparisons explaining more than 3% of the total variance. More recent high-resolution genetic analyses using ddRAD sequencing (Vargas-Fonseca et al. 2021) have significantly revised this understanding. The previously hypothesised migratory stock is no longer supported by the current evidence. Instead, the most pronounced genetic differentiation occurs between the southestern population around Plettenberg Bay (now the Agulhas Bioregion subpopulation) and populations in KZN (Natal Bioregion subpopulation). Within KZN, weaker genetic structuring is observed on either side of Ifafa, but seasonal movements likely obscure clear population boundaries, complicating assessments of stock structure.
Regional population effects: There may be dispersal, and thus potential for rescue effects, between northern KZN and Mozambique, but this has not yet been assessed.
Reasons for Change
Reason(s) for Change in Red List Category from the Previous Assessment: (Not specified)
Red List Index
Red List Index: (Not specified)
Recommended citation: Vargas-Fonseca OA, Probert R, Hoelzel R & da Silva JM. 2025. A conservation assessment of Tursiops aduncus. In Patel T, Smith C, Roxburgh L, da Silva JM & Raimondo D, editors. The Red List of Mammals of South Africa, Eswatini and Lesotho. South African National Biodiversity Institute and Endangered Wildlife Trust, South Africa.
Regional Distribution and occurrence
Geographic Range
The Indo-Pacific Bottlenose Dolphin has a discontinuous distribution in the warm-temperate to tropical Indo-Pacific, from South Africa in the west, along the rim of the Indian Ocean (including the Red Sea, Persian Gulf and Indo-Malay Archipelago as far east as the Solomon Islands and possibly New Caledonia) to the southern half of Japan and southeast Australia, in the east (Möller & Beheregaray 2001; Wells & Scott 2002).
Along the African coast, Indo-Pacific Bottlenose Dolphins range from South Africa to Kenya, including islands such as Zanzibar and Madagascar (Best 2007). Within the assessment region, they range from Cape Agulhas (although they have been sighted in False Bay) to Kosi Bay and into Mozambique (Best 2007). Further research must investigate the connectedness between the KZN and the Mozambique dolphins. Along the Eastern Cape and KZN coastline, they occur in water less than 30–50 m deep (Ross et al. 1987), and only within 10 km of the shoreline. Correspondingly, most of the population occurs within 500 m to 2 km of the coastline. The length of the coastline from False Bay to Kosi Bay is 2,661 km (including estuaries). As such we can calculate extent of occurrence and area of occupancy for the subpopulations.
Along the KZN coast, they appear to have more occupied or preferred areas about 30 km apart, but it is uncertain whether this pertains to home ranges (Cockcroft et al. 1991, 1992; Caputo et al. 2021). Previously, differences in organochlorine levels between individuals in areas 70–80 km apart on the KZN coast suggested discrete subpopulations (Cockcroft et al. 1989), and the habit of individuals stealing fish from fishing hooks off Margate, but not in adjacent areas, also suggested limited dispersal or restricted home ranges (Cockcroft et al. 1990). However, recent molecular data indicate differentiation between the subpopulations north and south of Ifafa (Vargas-Fonseca et al. 2021), with a natural boundary between these populations characterised by the annual Sardine Run, typically occurring mostly south of Ifafa. While a migratory subpopulation from previous assessment was hypothesised to follow the Sardine Run (Cockcroft et al. 1991 cited in Best 2007), there is conflicting evidence for this due to the stomach contents of this subpopulation showing few sardines (S. Plön unpubl. data). However, the latter may be an indication of a change in the Sardine Run. Similarly, Friedmann & Daly (2004) suggested that the migratory individuals may originate as far west as Plettenberg Bay and range into southern KZN. Although it was assumed that the seasonal subpopulation was a vehicle of gene flow between the southern (Eastern Cape) and northern (KZN) areas, Natoli et al. (2008) suggested that no genetic differentiation would have been detected if this was the case. Genetic data from Vargas-Fonseca et al. (2021) suggest a clear population structure between the eastern and southern coasts correlated with the habitat transition between the temperate Agulhas (southern) and subtropical Natal (eastern) Bioregions, suggesting differentiation driven by resource specialisations. Along the Natal Bioregion, differentiation was comparatively weak, with a division either side of Ifafa, and some shift in the boundary between the KZN populations during the Sardine Run.
Elevation / Depth / Depth Zones
Elevation Lower Limit (in metres above sea level): (Not specified)
Elevation Upper Limit (in metres above sea level): (Not specified)
Depth Lower Limit (in metres below sea level): 50 m
Depth Upper Limit (in metres below sea level): 0 m
Depth Zone: (Not specified)
Map
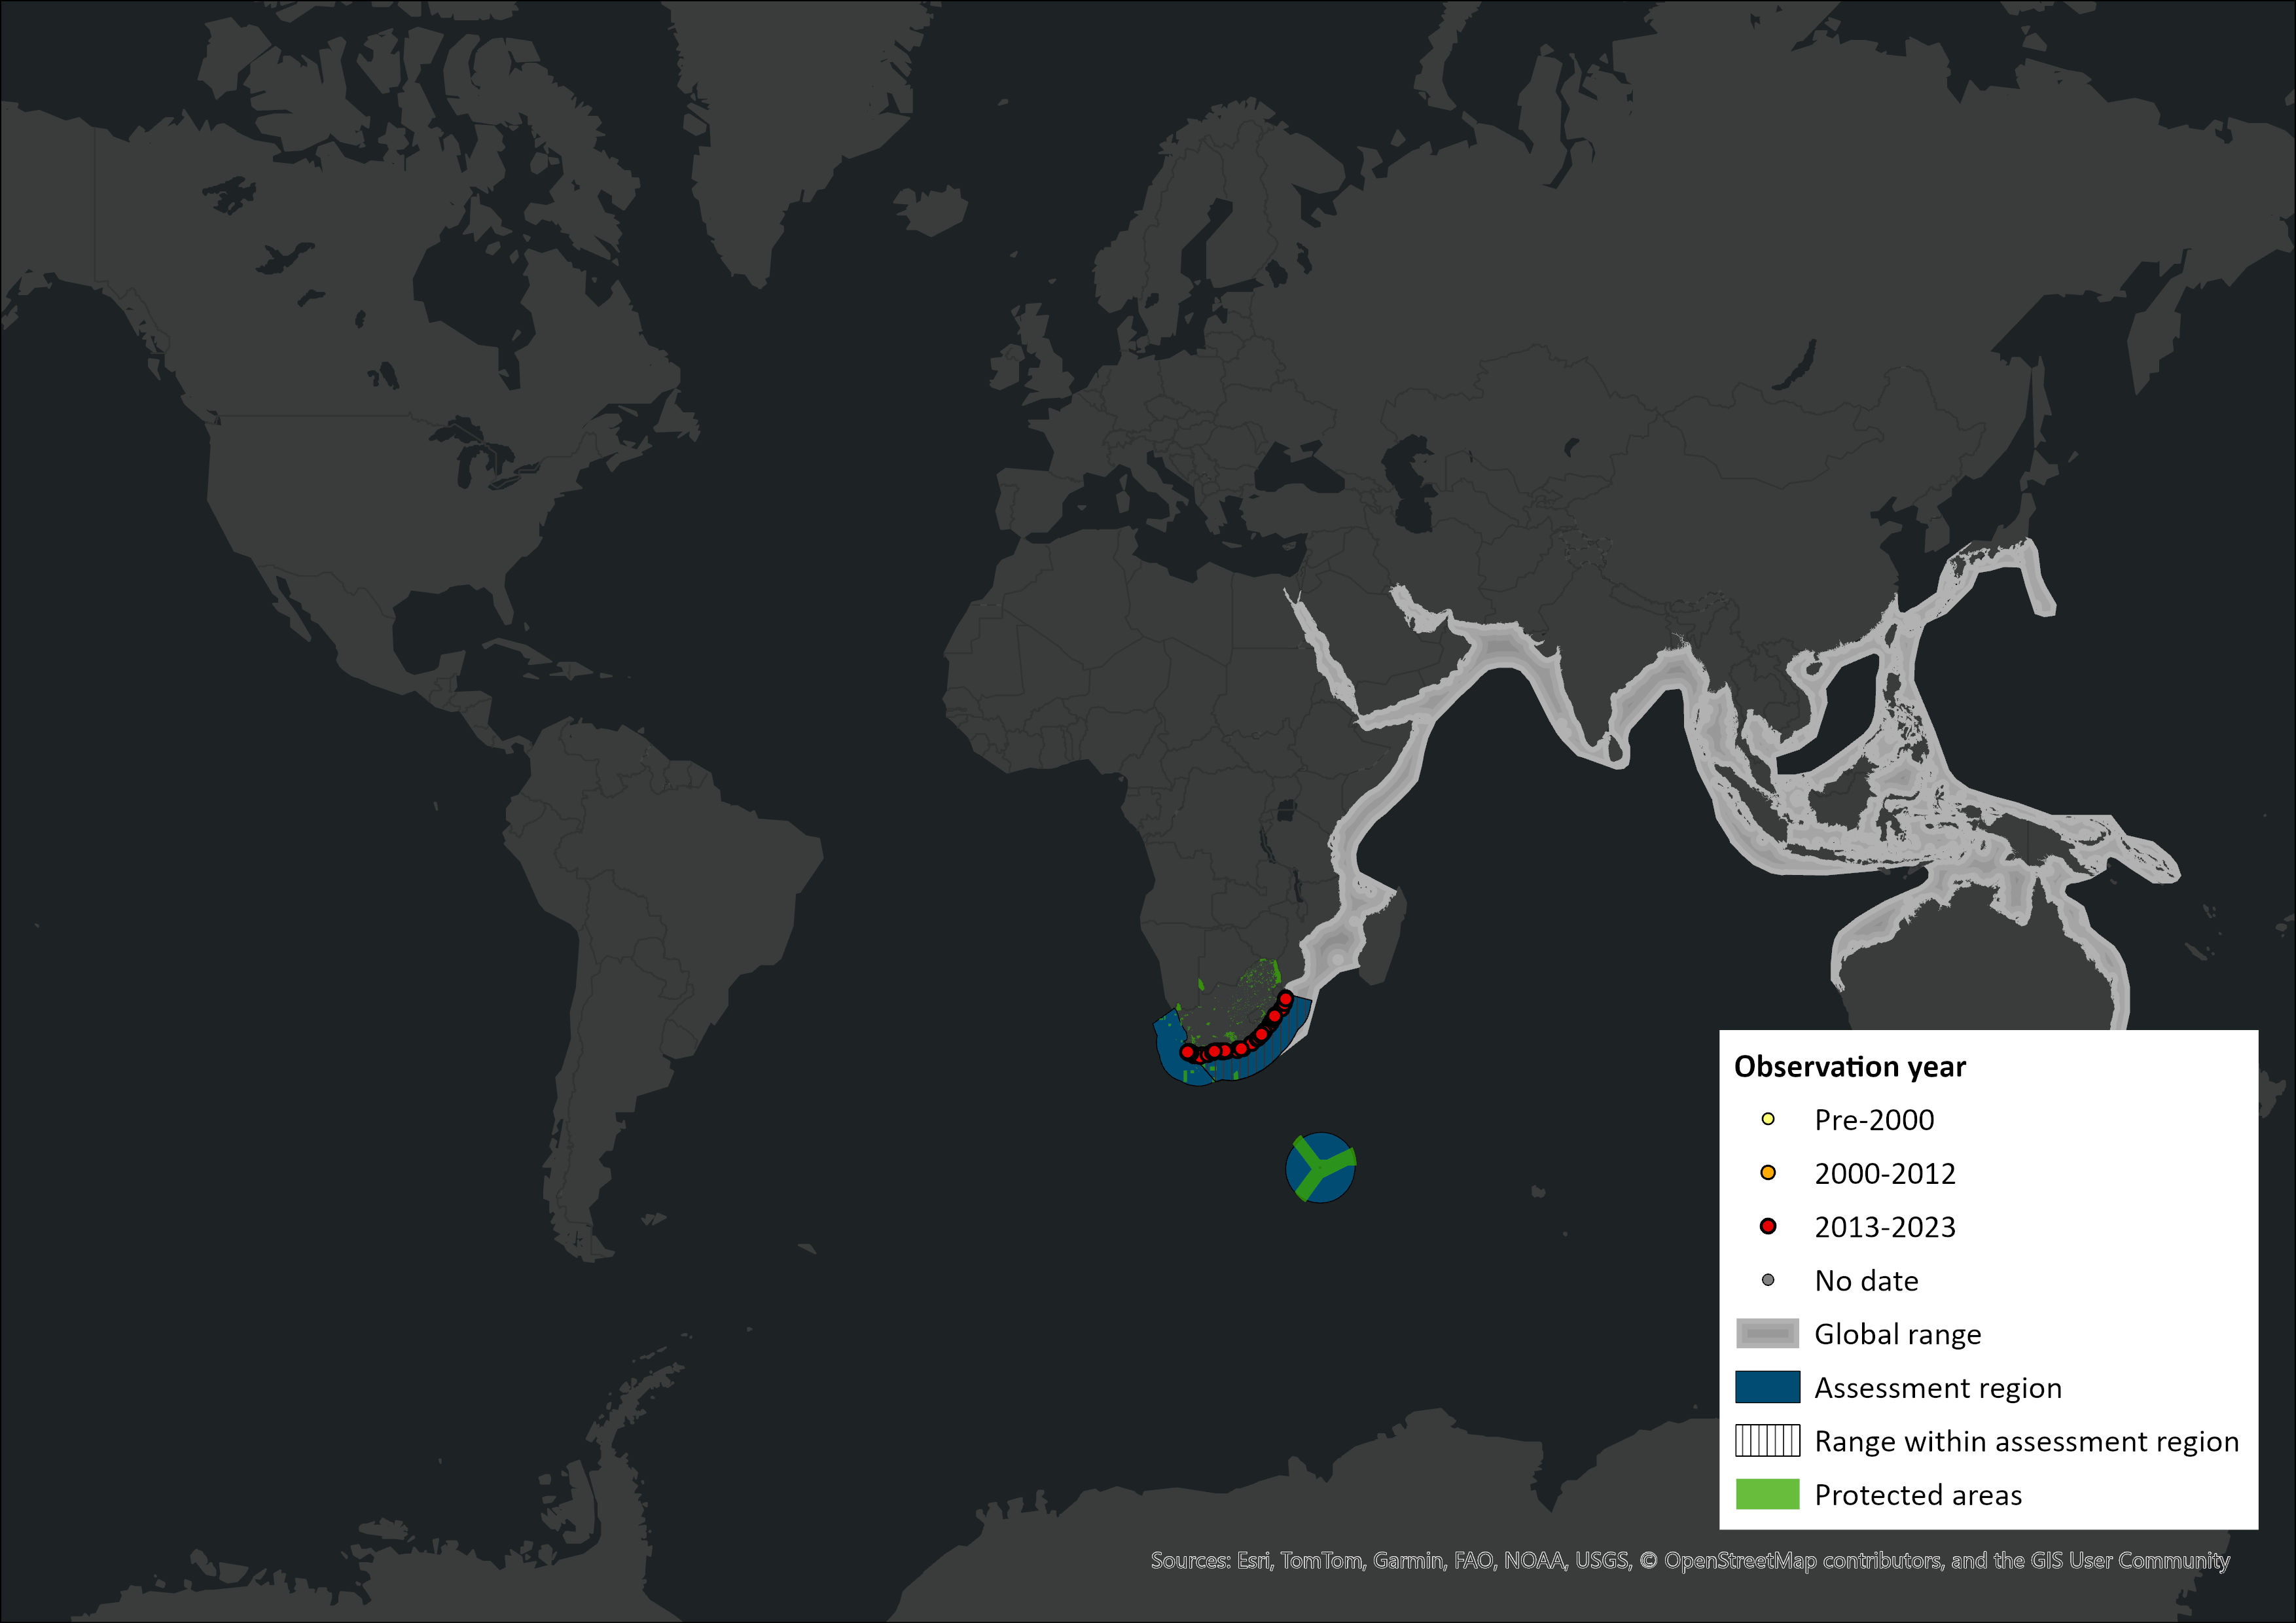 Figure 1. Distribution records for Indo-Pacific Bottlenose Dolphin (Tursiops aduncus) within the assessment region (South Africa, Eswatini and Lesotho). Note that distribution data is obtained from multiple sources and records have not all been individually verified.
Biogeographic Realms
Biogeographic Realm: Afrotropical, Australasian, Indomalayan, Palearctic
Occurrence
Countries of Occurrence
| Country | Presence | Origin | Formerly Bred | Seasonality |
| Australia | Extant | Native | – | Resident |
| Bahrain | Extant | Native | – | Seasonal Occurrence Uncertain |
| Bangladesh | Extant | Native | – | Seasonal Occurrence Uncertain |
| Brunei Darussalam | Extant | Native | – | Seasonal Occurrence Uncertain |
| Cambodia | Extant | Native | – | Seasonal Occurrence Uncertain |
| China | Extant | Native | – | Breeding Season |
| Christmas Island | Presence Uncertain | Native | – | Seasonal Occurrence Uncertain |
| Comoros | Extant | Native | – | Seasonal Occurrence Uncertain |
| Djibouti | Presence Uncertain | Native | – | Seasonal Occurrence Uncertain |
| Egypt | Extant | Native | – | Seasonal Occurrence Uncertain |
| Eritrea | Extant | Native | – | Seasonal Occurrence Uncertain |
| Hong Kong | Presence Uncertain | Vagrant | – | – |
| India | Extant | Native | – | Seasonal Occurrence Uncertain |
| Indonesia | Extant | Native | – | Seasonal Occurrence Uncertain |
| Iran, Islamic Republic of | Extant | Native | – | Resident |
| Iraq | Presence Uncertain | Native | – | Seasonal Occurrence Uncertain |
| Japan | Extant | Native | – | Resident |
| Jordan | Presence Uncertain | Native | – | Seasonal Occurrence Uncertain |
| Kenya | Extant | Native | – | Seasonal Occurrence Uncertain |
| Kuwait | Presence Uncertain | Native | – | Seasonal Occurrence Uncertain |
| Macao | Presence Uncertain | Vagrant | – | – |
| Madagascar | Extant | Native | – | Seasonal Occurrence Uncertain |
| Malaysia | Extant | Native | – | Seasonal Occurrence Uncertain |
| Mayotte | Extant | Native | – | Seasonal Occurrence Uncertain |
| Mozambique | Extant | Native | – | Seasonal Occurrence Uncertain |
| Myanmar | Extant | Native | – | Seasonal Occurrence Uncertain |
| Oman | Extant | Native | – | Seasonal Occurrence Uncertain |
| Pakistan | Extant | Native | – | Seasonal Occurrence Uncertain |
| Papua New Guinea | Extant | Native | – | Seasonal Occurrence Uncertain |
| Philippines | Extant | Native | – | Seasonal Occurrence Uncertain |
| Qatar | Presence Uncertain | Native | – | Seasonal Occurrence Uncertain |
| Saudi Arabia | Extant | Native | – | Seasonal Occurrence Uncertain |
| Singapore | Extant | Native | – | Seasonal Occurrence Uncertain |
| Solomon Islands | Extant | Native | – | Resident |
| Somalia | Extant | Native | – | Seasonal Occurrence Uncertain |
| South Africa | Extant | Native | – | Seasonal Occurrence Uncertain |
| Sri Lanka | Extant | Native | – | Seasonal Occurrence Uncertain |
| Sudan | Presence Uncertain | Native | – | Seasonal Occurrence Uncertain |
| Taiwan, Province of China | Extant | Native | – | Breeding Season |
| Tanzania, United Republic of | Extant | Native | – | Seasonal Occurrence Uncertain |
| Thailand | Extant | Native | – | Seasonal Occurrence Uncertain |
| Timor-Leste | Extant | Native | – | Seasonal Occurrence Uncertain |
| United Arab Emirates | Extant | Native | – | Seasonal Occurrence Uncertain |
| Viet Nam | Possibly Extinct | Native | – | Seasonal Occurrence Uncertain |
| Yemen | Extant | Native | – | Seasonal Occurrence Uncertain |
Large Marine Ecosystems (LME) Occurrence
Large Marine Ecosystems: Agulhas Current LME
FAO Area Occurrence
| Presence | Origin | Formerly Bred | Seasonality | |
| 51. Indian Ocean – western | Extant | Native | – | – |
| 57. Indian Ocean – eastern | Extant | Native | – | – |
| 61. Pacific – northwest | Extant | Native | – | – |
| 71. Pacific – western central | Extant | Native | – | – |
Climate change
Over the years significant climatic shifts have been documented in the Agulhas current system, including increased sea surface temperatures (SST) and fluctuating wind regimes (Mead et al. 2013; Asdar et al. 2022). The average SST in the Agulhas Bank increased by 1.5oC from the 1980s to the early 2000s (Mead et al. 2013) and is estimated to further increase by 2oC between 2020 and 2100 (Asdar et al. 2022). Indo-Pacific Bottlenose Dolphins have been reported in ocean temperatures between 11.3 and 22.7oC on the south coast of South Africa (Vargas-Fonseca et al. 2018), indicating a wide thermal range. They are also highly mobile, traveling hundreds of kilometers along the coastline. Therefore, as an entire South African population, they are not likely to be severely impacted by increasing temperatures due to their wide thermal range and various suitable habitats along the coast. However, this may drive a shift in the distribution of subpopulations and prey species along the coast. Increasing temperatures can also increase energy demands and feeding rates of T. aduncus have been shown to decrease with increasing water temperatures (Ross & Cockroft 1990).
Indo-Pacific Bottlenose Dolphins face many threats that can be exacerbated by climate change, for example, habitat loss and a reduction in food resources. Coral bleaching is associated with an increase in SST and has been documented along the South African coast (Celliers & Schleyer 2002), causing the loss of coral reef habitats along the east and south coastlines, and reducing the biomass of reef fish, important prey species for T. aduncus. Increasing SST also strongly affects the distribution and stocks of other important prey species, such as temperate reef and demersal fish (Clark 2006). Declining fish stocks will exacerbate the already prevalent competition between T. aduncus and South African fisheries by increased fishing pressure because of decreased biomass. Consequently, an increased risk of entanglement in fishing gear and bycatch, another prevalent threat to the species, will result from increased fishing pressures. Indo-Pacific Bottlenose Dolphins are also at risk of heavy metal contamination through the food chain, including PCBs, which can affect the reproduction and survival of the species (Cockroft et al. 1989; Gui et al. 2016; Plön et al. 2023). Increased sea temperatures can influence the toxic potential of metals in marine species (Langston 1990); however, this has not been described specifically for dolphin species.
Climate change can have significant impacts on coastal dolphins; it can significantly impact their habitat, prey availability (abundance and distribution), and overall health of these dolphins. Changes in oceanic conditions can alter currents, temperature, and nutrient availability, causing mismatches in the timing of prey availability and the dolphins’ reproductive and feeding cycles. At the same time, it can contribute to the spread of diseases among dolphin populations. The surge in extreme weather events can lead to habitat destruction, heightened sedimentation, and alterations in water quality.
Population information
Although this species was split into a migratory and resident subpopulation in the 2004 assessment (Friedmann & Daly 2004), subsequent molecular analyses indicate that the distinction was along the Agulhas and Natal Bioregions and within the latter, a weak differentiation north and south of Ifafa.
The population size and trends of the subpopulations are poorly known and confined to localised estimates. The Aghulas Bioregion subpopulation was thought to be in excess of 40,000 individuals overall; however, updated studies have indicated smaller population estimates on the south coast, and this subpopulation might be smaller than initially expected. For the subpopulation in the Agulhas Bioregion, only three capture-recapture abundance estimates are available. Previously, one estimate was available for Algoa Bay (1991–1994) where 28,482 (95% CI: 16,220–40,744) individuals were estimated (Reisinger & Karczmarski 2010), and another for Plettenberg Bay (2002–2003) where 6,997 (95% CI: 5,230–9,492) individuals were estimated (Phillips 2006). These studies found that many individuals were utilising both bays, indicating a dynamic population on the south coast of South Africa with long-range movements (Reisinger & Karczmarski 2010). The most recent assessment (Vargas-Fonseca et al. 2020) was between the Goukamma and Tsitsikamma Marine Protected Areas (including Plettenberg Bay) from 2014 to 2016 and estimated 2,155 individuals (95% CI: 1,873–2,479). This study also found a high proportion of transient individuals (i.e., 73% of identified individuals were encountered only once), suggesting that the individuals are part of an open population that ranges more widely. The only trend available in this bioregion is in Plettenberg Bay. The most recent estimates (2014 to 2016) predicted a total abundance of 1,815 (95% CI: 1,355–2,432) in indicating a 70% decline in abundance compared to 2002-2003 (Vargas-Fonseca et al. 2020).
Dolphin groups in Algoa Bay are generally large, ranging from 25 to over 500 individuals in the 90s’ (with 52% of the observed groups larger than 100 individuals; Reisinger & Karczmarski 2010). In a more recent assessment between 2008–2011 and 2015–2016, group size ranged from 1 to 600 individuals (x = 60; Melly et al. 2017; Bouveroux et al. 2018). However, group size increased significantly from an average of 18 animals in 2008 to 76 animals in 2016 (Bouveroux et al. 2018). Between Goukamma and Tsitsikamma MPA the average group size between 2014 and 2016 was estimated as 47 ± 55 (mean ± standard deviation (SD)) individuals aggregating in larger groups in colder water (Vargas-Fonseca et al. 2018). However, in Plettenberg Bay only, the mean group size was estimated to be 26 ± 26 individuals. The 2014–2016 Plettenberg Bay group size estimate was approximately 78% lower than that reported for 2002–2003 with an average of 120 individuals (Vargas-Fonseca et al. 2018). The declining group size trend is further supported by a shore-based group size estimate of 140 individuals from the early 1970s (Saayman et al. 1973).
Further north along the Eastern Cape coastline along the Wild Coast (Kei Mouth, Hluleka, Mkambati) group sizes ranged from 1-250 (x = 33; Bouveroux et al. 2018). Caputo et al. (2021) observed individuals year-round, indicating that T. aduncus use this stretch of coastline outside of the Sardine Run season, and show some degree of residency. Therefore, future population estimates in this part of the habitat range should be assessed separately.
For the Natal subpopulation (previously Ifafa-Kosi Bay), there are an estimated 631–848 (95% confidence intervals: 462–1,321) individuals within the Durban Bay area (S. Elwen, unpubl. data). For the KZN resident stock (both north and south coast), Cockcroft et al. (1992) estimated 520–530 individuals. However, given that estimate from relatively few surveys in Durban Bay alone is nearly up to 1,000 individuals, there are possibly considerably more animals along the entire coast to Kosi Bay. For example, Photopoulou et al. (2011) reported three groups per hour passing Cape Vidal at a median group size of 22 individuals. Estimates of average density from aerial counts indicate that densities on the KZN South Coast are an order of magnitude less than those off the North Coast and the coast of the Transkei (Ross et al. 1989). Model-based estimates of generation time are 21 years (Taylor et al. 2007).
The previously thought migratory population that overlaps the habitat range of the now Natal Bioregion subpopulations north and south of Ifafa is estimated at around 2,000 individuals, travelling in large groups of hundreds of individuals (see Natoli et al. 2008). However, now we understand that this may just reflect seasonal movement of the KZN populations during the Sardine Run (Vargas-Fonseca et al. 2021).
Current population trend: Declining
Continuing decline in mature individuals? Yes, due to ongoing mortality in shark nets
Number of mature individuals in population: Unknown
Number of mature individuals in largest subpopulation: 16,000-30,000
Extreme fluctuations in the number of subpopulations: (Not specified)
Continuing decline in number of subpopulations: (Not specified)
All individuals in one subpopulation: No
Severely fragmented: No
Number of Subpopulations: 2
Quantitative Analysis
Probability of extinction in the wild within 3 generations or 10 years, whichever is longer, maximum 100 years: (Not specified)
Probability of extinction in the wild within 5 generations or 20 years, whichever is longer, maximum 100 years: (Not specified)
Probability of extinction in the wild within 100 years: (Not specified)
Population genetics
The South African population of Indo-Pacific Bottlenose Dolphins are split into at least two coastal subpopulations, the Agulhas and Natal Bioregions. The previously thought subpopulations either side of Ifafa and a putative migratory population were identified using microsatellite and mitochondrial DNA (mtDNA) analysis (Natoli et al. 2008). However, temporal genetic assessments, comparing samples from within and outside the Sardine Run period (Vargas-Fonseca et al. 2021), have provided greater clarity about the nature of the population divisions between the Agulhas and Natal bioregions. Inside KZN itself, there aren’t separate, permanent populations, but there is seasonal mixing. Dolphins seem to form loose, temporary groups during the Sardine Run, causing small genetic differences among animals sampled in different seasons. Microsatellite DNA showed significant differentiation between all South African regions and Zanzibar, but finer scale assessment between Richards Bay and Zanzibar is not yet available. MtDNA suggested the possibility of some connectivity with South Zanzibar (Särnblad et al. 2011), though there was clear differentiation with North Zanzibar (Gray et al. 2021). The estimated rate of gene flow between the Agulhas (Plettenberg Bay / Knsyna) and Natal Bioregion (KZN north and south) was very low, and somewhat higher between the putative populations either side of Ifafa, with the level of within population diversity similar for all putative populations (Vargas-Fonseca et al. 2021). Temporal analyses in Vargas-Fonseca et al. (2021) did not show any seasonal changes in connectivity between Plettenberg Bay and KZN.
The size of the entire population of Indo-Pacific Bottlenose Dolphin within the assessment region is not known. Previous estimates were confined to local areas, many of which are out-dated. For the Natal Bioregion (previously named Ifafa-Kosi Bay) subpopulation, Cockroft et al. (1992) estimated only 520-530 individuals along the northern KZN coast. However, estimates from Durban alone were 631-848 individuals (S. Elwen unpubl. data), suggesting that this subpopulation is considerably larger and there are likely more than 1,000, but less than 2,500, mature individuals. Re-evaluation of these population estimates is necessary for an up-to-date subpopulation assessment. The Agulhas Bioregion subpopulation (previously considered the Ifafa-False Bay region) was thought to include more than 40,000 individuals from local estimates calculated for Algoa Bay from 1991 and 1994 (16,220-40,744 individuals; Reisinger & Karczmarski 2010) and Plettenberg Bay from 2002 to 2003 (8,000-12,000; Phillips 2006). Fewer individuals were documented between the Tsitsikamma and Goukamma Marine Protected Areas from 2014 to 2016 (1,873-2,479 individuals), and it was recently reported that the population using Plettenberg Bay had decreased by 70% since 2003 (Vargas-Fonseca et al. 2020). It is unclear whether this decline was due to movement of individuals out of the bay, or if population numbers had, in fact, decreased. However, this decline paired with the recent smaller population estimate in the Goukamma-Tsitsikamma region more likely suggests a population decline since the 1990s and early 2000s.
Based on the available data, all subpopulations of this species remain (i.e., none have gone extinct), suggesting a Populations Maintained indicator value of 1.0. However, based on the available census estimates and expert input, the effective population sizes (Ne) of the remaining populations based on proxy data differ considerably. Assuming a Ne/Nc conversion ratio of 0.1-0.3, the Ne for the Natal subpopulation is estimated between 100-750 individuals, straddling the Ne 500 threshold. While the Aghulas subpopulation appears more stable with an Ne estimated between 4,000-12,000 individuals. According to these proxy calculations, the Ne 500 indicator may be 0.5 or 1.0, depending on which side of the threshold is used for the Natal subpopulation. As noted above, more updated census counts and Ne quantifications based on actual genetic data would better inform this.
Habitats and ecology
Indo-Pacific Bottlenose Dolphins generally occur over shallow coastal waters (less than 50 m depth) on the continental shelf or around oceanic islands. They sometimes occur in mixed groups with Humpback Dolphins (Sousa plumbea) and other delphinid species (Koper & Plön, 2016). They feed on a wide variety of schooling, demersal and reef fishes, as well as cephalopods (Ross 1984; Cockcroft 1990).
Ecosystem and cultural services: This is the archetype of dolphins and, since most South Africans are unaware of the variety of delphinids, this is typically what they envisage when “dolphins” are mentioned. As such, they are a flagship species. They are also an indicator species: coastal dolphins, as long-lived, long-term residents along the coast, can serve as important sentinels of the health of coastal marine ecosystems (Wells et al. 2004; Lane et al. 2014; Gui et al. 2016; Plön et al. 2024). As top-level predators on a wide variety of fishes and squids, they concentrate contaminants through bioaccumulation and integrate broadly across the ecosystem in terms of exposure to environmental impacts (Cockcroft et al. 1989; Plön et al. 2023).
Among diverse San-Khoe descendants, Xhosa, and Zulu speaking coastal communities, dolphins hold various of cultural and spiritual significance. Dolphins are sometimes considered as ‘protectors’ of humans at sea or as messengers of ancestors, with accounts of them guiding people to safety or saving people from drowning. Such beliefs reflect a relational worldview of human-animal kinship whereby dolphins are not merely animals but sentient beings with agency and purpose. This aligns with broader African cosmologies that view the ocean as an animated source of life, inhabited by spirits and ancestral forces which foster deeper connections to the sea (Vargas-Fonseca et al. in prep).
IUCN Habitats Classification Scheme
| Habitat | Season | Suitability | Major Importance? |
| 9.1. Marine Neritic -> Marine Neritic – Pelagic | – | Suitable | Yes |
| 10.1. Marine Oceanic -> Marine Oceanic – Epipelagic (0-200m) | – | Marginal | – |
Life History
Generation Length: 25 years
Age at Maturity: Female or unspecified: 8-10 years
Age at Maturity: Male: 10-12 years
Size at Maturity (in cms): Female: 260cm
Size at Maturity (in cms): Male: 260-270 cm
Longevity: 40 years (up to 50 years)
Average Reproductive Age: 10 years
Maximum Size (in cms): 270 cm
Size at Birth (in cms): ~1m
Gestation Time: 12 months
Reproductive Periodicity: Birth intervals 3–5 years
Average Annual Fecundity or Litter Size: 1
Natural Mortality: (Not specified)
Breeding Strategy
Does the species lay eggs? No
Does the species give birth to live young: Yes
Does the species exhibit parthenogenesis: No
Does the species have a free-living larval stage? No
Does the species require water for breeding? Yes
Movement Patterns
Movement Patterns: within Bioregions
Congregatory: (Not specified)
Systems
System: Marine
General Use and Trade Information
There is local opportunistic medicinal and food use of stranded animals.
|
Subsistence: |
Rationale: |
Local Commercial: |
Further detail including information on economic value if available: |
|
Yes |
– |
– |
– |
National Commercial Value: Yes
International Commercial Value: Yes
|
End Use |
Subsistence |
National |
International |
Other (please specify) |
|
1. Food – human |
true |
true |
– |
– |
|
13. Pets/display animals, horticulture |
– |
true |
true |
– |
Is there harvest from captive/cultivated sources of this species? (Not specified)
Harvest Trend Comments: (Not specified)
Threats
The species’ near-shore distribution makes it vulnerable to habitat degradation and fishery conflicts, which include gillnets and purse seines. Within the assessment region, Indo-Pacific Bottlenose Dolphins are exposed to a wide variety of threats.
Bycatch on gillnets: They suffer considerable mortality in the large-mesh gillnets set to protect bathers from sharks (Cockcroft 1990, 1992; Dudley 1997; Peddemors 1999; Reeves et al. 2003). Between 1980 and 2005 between 14 and 62 (mean 37) dolphins have been caught annually in the shark nets between Richards Bay and Port Edward (Peddemors et al. 1998; Best 2007). Similarly, Lane et al. (2014) report at least 35 T. aduncus collected from nets between 2010 and 2012, and Plön et al. (2020) report 47 collected between 2013 and 2015, with most from Durban and further north. A high proportion (22-23%, Cockroft et al. 1990; Plön et al. 2020) of the Indo-Pacific Bottlenose Dolphins were mature or reproductively active females, who have a high reproductive value and are an integral part of maintaining stability in terms of population size (Coulson et al. 2001). The high number of annual catches has been identified as a conservation concern since at least the 1960s (Peddemors 1993) and has been thought to play a central role in the reduction of sighting rates of animals in the region between the 1970s and 1980s (Cockcroft et al. 1990). Historically, bycatch has been a greater threat to the northern subpopulation than to the southern subpopulation.
Pollution: Accumulation of pollutants and heavy metals, such as toxic xenobiotic chemicals and pesticides, may affect reproduction and survival (Cockcroft et al. 1989; Gui et al. 2016; Plön et al. 2023). Pollution was more severe for the north coast subpopulation in KZN (Cockcroft et al. 1989). A more recent analysis shows continued high levels of PCBs and DDT compounds in the species across most of the species’ range within South African waters (Gui et al. 2016). Furthermore, these toxins are also transferred from mothers to their calves through lactation, where almost 80% of the toxin residue load in a female dolphin is transferred to the first-born calf and can be potentially fatal to the calf (Cockcroft et al. 1989).
Fisheries competition: Reduced prey availability caused by environmental degradation and overfishing (Jackson et al. 2001). Unsustainable fishing of reef fishes has reduced habitat suitable for prey fish nursery areas (estuaries). Climate change is also likely to exacerbate shifts in prey base (Potts et al. 2015).
Disturbance: Direct and indirect disturbance and harassment (for example, boat traffic and commercial dolphin watching and interactive programs) may effectively reduce occupancy and reproductive success. Underwater noise is of growing concern to cetaceans. Anthropogenic noise, for example boat engines and pile driving, is known to disrupt the presence, behaviour and vocal characteristics of T. aduncus (Paiva et al. 2015; Marley et al. 2017), which can have impacts on the activity budgets and biological function of individual dolphins. The problem of noise pollution and the impacts on T. aduncus should be addressed within the assessment range as there are no studies to date.
Habitat degradation: Marine construction and demolition and other forms of habitat destruction and degradation (including anthropogenic noise and coral reef bleaching due to climate change). For example, the development of harbours and continued requirement for additional quay space has resulted in continued degradation of estuaries, leading to destruction of important foraging areas. Additionally, farming and water use malpractices have led to siltation of nearshore reefs and estuaries, but this is reversible through education and planting away from riverbanks.
Although these and other threats are technically challenging to quantify, their cumulative impact may result in longitudinal population declines. Lack of historical data in many cases hampers understanding of long-term trends, possibly resulting in shifting baselines.
Current habitat trend: Declining in quality due to ongoing coastal development and poor agricultural practices upstream of watersheds.
Conservation
This species occurs in several Marine Protected Areas (MPAs), including the Maputaland MPA, Trafalgar MPA, Mkambati MPA, Dweza Cwebe MPA, Tsitsikamma MPA, Robberg MPA and Goukamma MPA. It is listed in Appendix II of the Convention on International Trade in Endangered Species of Wild Fauna and Flora (CITES) and protected under the Marine Living Resources Act (No. 18 of 1998). The conservation of the KZN stock should be prioritised to allow the stock to recover from prolonged exploitation (Goodwin et al. 1996).
There are several priority interventions that should be continued within the assessment region:
Reduce bycatch: Various strategies have been tested to mitigate the unintentional catch in the shark nets. Devices have been added to the nets to make the nets more conspicuous acoustically (for example, air-filled floats, clangers), or to deter the dolphins with sounds (such as pingers) but have not been successful (Peddemors et al. 1990; Cliff & Dudley 2011; Erbe et al. 2016). Modifying the fishing gear by increasing the mesh size had more success but was not a viable option (Dudley 1997; Cliff & Dudley 2011). Although not determined statistically, the annual catch rate of Indo-Pacific Bottlenose Dolphins may have been lower in the period 2000–2009 than the previous decade (from 45 ± 14 individuals during 1990–1999 to 27 ± 7 individuals during 2000–2009; Cliff & Dudley 2011), possibly due to the reduction of fishing effort (the permanent removal of one or two of the nets) at most beaches, time/area closures (the temporary removal of some nets during the Sardine Run), and gear change (the replacement of some nets with baited hooks (drumlines) which do not catch cetaceans (Dudley et al. 1998; Dudley & Cliff 2010; Cliff & Dudley 2011). A more recent study has indicated a further decline in annual bycatch rates, with 16 ± 6 individuals from 2010 to 2015 (Plön et al. 2020). However, reduced catch rates since the 1990s may also indicate a declining population. Overall, ongoing bycatch is still a threat to the dolphins as they have very low intrinsic rates of population growth because of their life history characteristics: they grow slowly, mature late, and bear only one calf per pregnancy with long inter-calf intervals (Reilly & Barlow 1986).
Regulate agricultural, industrial and urban pollution:
Stricter regulations on the agriculture and industrial sectors should be enforced to curb pollution levels. For example, bio-friendly insecticides should be compulsory. Contaminant analysis should be conducted on each subpopulation to assess the relative level of contaminants (Plön et al. 2023). Coastal development needs to be more stringently regulated.
Reduce competition with fisheries:
Near-shore fisheries need to be more stringently regulated, and penalties enforced. Similarly, polices surrounding boat-based dolphin watching should be enforced.
Recommendations for managers and practitioners:
- Systematic monitoring of all putative subpopulations/stocks. The main target of the monitoring should be to gain precise estimates for each subpopulation and trends. Further population genetic data should be produced to extend previous results and more inclusively assess the pattern of subdivision across the species range in southern African waters.
- Monitoring the threat intensity for all putative subpopulations/stocks.
- Increase information sharing between agencies to enhance cooperation and facilitate the implementation of interventions.
Research priorities:
- Conduct further surveys to determine overall population size/trends and geographical extent of the putative subpopulations.
- Conduct genetic research to clarify the taxonomy of the genus Tursiops and to determine significant management units. Studies of numbers and genetics of animals north of Richards Bay into southern Mozambique is necessary to determine the vulnerability/isolation of the Natal subpopulation.
- Further research is needed to determine the level of connectivity among other regional populations across the broader distributional range, especially between KZN and Zanzibar, in the Eastern Cape, and between Plettenberg and False Bay.
- Assessing the effectiveness of MPAs in conserving threatened subpopulations, especially those in northern KZN, the results of which should feed into developing guidelines for MPA development.
- Conduct research on anthropogenic noise (particularly vessel traffic and resource exploration) and the resultant effects on Indo-Pacific Bottlenose Dolphins throughout the assessment range.
Encouraged citizen actions:
- Use information dispensed by the South African Sustainable Seafood Initiative (SASSI) to make good choices when buying fish in shops and restaurants (wwfsa.mobi, FishMS 0794998795).
- Buy fresh produce that has been grown in pesticide-free environments.
- Save electricity and fuel to mitigate CO2 emissions and hence rate of climate change.
- Buy local products that have not been shipped.
- Reduce boat speed in coastal environments and do not approach or chase dolphins in boats or skis.
- Report sightings on virtual museum platforms (for example, iNaturalist, HappyWhale and MammalMAP). Report any stranded dolphins to your nearest museum or stranding network. When participating in whale/dolphin watching tours, use only official tour operators and ensure regulations are upheld.
Bibliography
Asdar S, Jacobs ZL, Popova E, Noyon M, Sauer WH, Roberts MJ. 2022. Projected climate change impacts on the ecosystems of the Agulhas Bank, South Africa. Deep Sea Research Part II: Topical Studies in Oceanography 200:105092.
Best, P.B. 2007. Whales and Dolphins of the Southern African Subregion. Cambridge University Press, Cape Town, South Africa.
Bouveroux TN, Caputo M, Froneman PW, Plön S. 2018. Largest reported groups for the Indo‐Pacific bottlenose dolphin (Tursiops aduncus) found in Algoa Bay, South Africa: Trends and potential drivers. Marine Mammal Science 34(3):645-65.
Caputo M, Bouveroux T, Froneman PW, Shaanika T, Plön S. 2021. Occurrence of Indo‐Pacific bottlenose dolphins (Tursiops aduncus) off the Wild Coast of South Africa using photographic identification. Marine Mammal Science 37(1):220-34.
Celliers L, Schleyer MH. 2002. Coral bleaching on high-latitude marginal reefs at Sodwana Bay, South Africa. Marine Pollution Bulletin 44(12):1380-7.
Clark BM. 2006. Climate change: A looming challenge for fisheries management in southern Africa. Marine Policy 30(1):84-95.
Cliff, G. and Dudley, S.F.J. 2011. Reducing the environmental impact of shark-control programs: a case study from KwaZulu-Natal, South Africa. Marine and Freshwater Research 62: 700–709.
Cockcroft VG, De Kock AC, Lord DA, Ross GJB. 1989. Organochlorines in bottlenose dolphins Tursiops truncatus from the east coast of South Africa. South African Journal of Marine Science 8: 207–217.
Cockcroft VG, Ross GJB, Peddemors VM. 1990. Bottlenose dolphin Tursiops truncatus distribution in Natal’s coastal waters. South African Journal of Marine Science 9: 1–10.
Cockcroft VG, Ross GJB, Peddemors VM. 1991. Distribution and status of bottlenose dolphin Tursiops truncatus on the south coast of Natal, South Africa. South African Journal of Marine Science 11: 203–209.
Cockcroft VG. 1990. Catches of dolphins in the Natal shark nets, 1990 to 1998. South African Journal of Wildlife Research 20: 44–51.
Cockcroft VG. 1992. Incidental capture of bottlenose dolphins (Tursiops truncatus) in shark nets: an assessment of some possible causes. Journal of Zoology 226: 123–134.
Cockcroft, V. G., Ross, G. J. B., Peddemors, V. M. and Borchers, D. L. 1992. Estimates of abundance and undercounting of bottlenose dolphins off northern Natal, South Africa. South African Journal of Wildlife Research 22: 102-109.
Coulson T, Catchpole EA, Albon SD, Morgan BJT, Pemberton JM, Clutton-Brock TH, Crawley MJ, Grenfell BT. 2001. Age, sex, density, winter weather, and population crashes in Soay sheep. Science 292: 1528–1531.
Dudley SFJ, Haestier R, Cox K, Murray M. 1998. Shark control: experimental fishing with baited drumlines. Marine and Freshwater Research 49: 653–661.
Erbe C, Wintner S, Dudley SF, Plön S. 2016. Revisiting acoustic deterrence devices: Long-term bycatch data from South Africa’s bather protection nets. In: Proceedings of Meetings on Acoustics (Vol. 27, No. 1). AIP Publishing.
Friedmann, Y. and Daly, B. 2004. Red Data Book of the Mammals of South Africa: A Conservation Assessment. Conservation Breeding Specialist Group (SSC/IUCN) and Endangered Wildlife Trust, Parkview, South Africa.
Goodwin, J.A., Durham, B.D., Peddemors, V.M. and Cockcroft, V.G. 1996. Genetic variation in the bottlenose dolphin Tursiops truncatus along the KwaZulu/Natal coast, South Africa. South African Journal of Marine Science 17: 225–232.
Gray, H.W.I. 2015. Phylogeography and population structure in highly mobile marine taxa in the western Indian Ocean: bottlenose dolphins (Tursiops spp.) and common dolphins (Delphinus spp.). Ph.D. Thesis. Durban University of Technology.
Gray HWI, Chen I, Moura AE, Natoli A, Nishida S, Tanabe S, Minton G, Ponnampalam LS, Kiani MS, Culloch R, Gore M, Särnblad A, Amir O, Berggren P, Collins T, Willson AJ, Baldwin R, Hoelzel AR (2021) Comparative biogeography and the evolution of population structure for bottlenose and common dolphins in the Indian Ocean. J. Biogeog. DOI: 10.1111/jbi.14102
Gray H, Van Waerebeek K, Owen J, Collins T, Minton G, Ponnampalam L, Willson A, Baldwin R, Hoelzel AR. (2022) Evolutionary drivers of morphological differentiation among three bottlenose dolphin lineages, Tursiops spp. (Delphinidae), in the northwest Indian Ocean utilising linear and geometric morphometric techniques. Biol. J. Linn. Soc. 135, 610-629.
Gui, D., L. Karczmarski, R.-Q. Yu, S. Plön, L. Chen, Q. Tu, G. Cliff and Y. Wu. 2016. Profiling and Spatial Variation Analysis of Persistent Organic Pollutants in South African Delphinids. Environmental Science and Technology 50(7): 4008-4017.
Jackson, J. B. C., Kirby, M. X., Berger, W. H., Bjorndal, K. A., Botsford, L. W., Bourque, B. J., Bradbury, R. H., Cooke, R., Erlandson, J., Estes, J. A., Hughes, T. P., Kidwell, S., Lange, C. B., Lenihan, H. S., Pandolfi, J. M., Peterson, C. H., Steneck, R. S., Tegner, M. J. and Warner, R. R. 2001. Historical overfishing and the recent collapse of coastal ecosystems. Science 293: 629-637.
Koper, R. P., & Plön, S. (2016). Interspecific interactions between cetacean species in Algoa Bay, South Africa. Aquatic Mammals, 42(2), 454-461.
Lane EP, De Wet M, Thompson P, Siebert U, Wohlsein P, Plön S. 2014. A systematic health assessment of Indian Ocean bottlenose (Tursiops aduncus) and Indo-Pacific humpback (Sousa plumbea) dolphins incidentally caught in shark nets off the KwaZulu-Natal Coast, South Africa. PloS One 9.
Langston, W.J. 1990. Toxic effects of metals and the incidence of metal pollution in the marine ecosystem. In: R.W. Fumess and P.S. Rainbow (eds.) Heavy Metals in the Marine Environment. CRC Press, Boca Raton, Florida. 256pp.
Marley SA, Salgado Kent CP, Erbe C, Parnum IM. 2017. Effects of vessel traffic and underwater noise on the movement, behaviour and vocalisations of bottlenose dolphins in an urbanised estuary. Scientific Reports 7(1):13437.
Mead A, Griffiths CL, Branch GM, McQuaid CD, Blamey LK, Bolton JJ, Anderson RJ, Dufois F, Rouault M, Froneman PW, Whitfield AK. 2013. Human-mediated drivers of change—impacts on coastal ecosystems and marine biota of South Africa. African Journal of Marine Science 35(3):403-25.
Melly, B. L., McGregor, G., Hofmeyr, G., & Plön, S. (2017). Spatio-temporal distribution and habitat use of cetaceans in Algoa Bay, South Africa. Journal of the Marine Biological Association of the U.K., 98(5), 1065-1079.
Moller, L. M. and Beteregaray, L. B. 2001. Coastal bottlenose dolphins from southeastern Australia are Tursiops aduncus according to sequences of the mitochondrial DNA control region. Marine Mammal Science 17(2): 249-263.
Moura, A.E., Nielsen, S.C., Vilstrup, J.T., Moreno-Mayar, J.V., Gilbert, M.T.P., Gray, H.W., Natoli, A., Möller, L. and Hoelzel, A.R. 2013. Recent diversification of a marine genus (Tursiops spp.) tracks habitat preference and environmental change. Systematic Biology 62: 865–877.
Moura, A.E., Shreves, K., Pilot, M., Andrews, K.R., Moore, D.M., Kishida, T., Moller, L., Natoli, A., Gaspari, S., McGowen, M., Chen, I., Gray, H., Gore, M., Culloch, R.M., Kiani. M.S.Willson, M.S., Bulushi, A., Collins, T., Baldwin, R., Wilson, A., Minton, G., Ponnampalam L, & Hoelzel, A.R. (2020) Phylogenomics of the genus Tursiops and closely related Delphininae reveals extensive reticulation among lineages and provides inference about eco-evolutionary drivers. Mol. Phylo & Evol. 146, 106756
Natoli, A., Peddemors, V. M. and Hoelzel, A. R. 2004. Population structure and speciation in the genus Tursiops based on microsatellite and mitochondrial DNA analyses. Journal of Evolutionary Biology 17: 363-375.
Natoli, A., Peddemors, V.M. and Hoelzel, A.R. 2008. Population structure of bottlenose dolphins (Tursiops aduncus) impacted by bycatch along the east coast of South Africa. Conservation Genetics 9: 627-636.
Paiva EG, Salgado Kent CP, Gagnon MM, McCauley R, Finn H. 2015. Reduced detection of Indo-Pacific bottlenose dolphins (Tursiops aduncus) in an inner harbour channel during pile driving activities. Aquatic Mammls 41(4):455-68.
Peddemors VM, Cockcroft VG, Best PB. 1998. Exploitation of small cetaceans off South Africa: 1978–1996. In: Scientific Committee of the International Whaling Commission (ed.). International Whaling Committee, Bournemouth,UK.
Peddemors VM, Cockcroft VG, Wilson R. 1990. Incidental dolphin mortality in the Natal shark nets: a preliminary report on prevention measures. In: Leatherwood S, Donovan G. (ed.), Cetaceans and cetacean research in the Indian Ocean Sanctuary, pp. 129–137. United Nations Environment Programme, Nairobi.
Peddemors VM. 1993. Use of commercial flights to census inshore marine mammals off Natal, South Africa. Lammergeyer 42: 43–47.
Peddemors, V. M. 1999. Delphinids of southern Africa: a review of their distribution, status and life history. Journal of Cetacean Research and Management 1(2): 157-165.
Phillips GL. 2006. Bottlenose dolphins (Tursiops aduncus) in Plettenberg Bay, South Africa: population estimates and temporal dynamics of groups. M.Sc. Thesis. Nelson Mandela Metropolitan University.
Photopoulou T, Best PB, Hammond PS, Findlay KP. 2011. Movement patterns of coastal bottlenose dolphins in the presence of a fast-flowing, prevailing current: shore-based observations at Cape Vidal, South Africa. African Journal of Marine Science 33: 393–401.
Plön, S., Roussouw, N., Uren, R., Naidoo, K., Siebert, U., Cliff, G., & Bouwman, H. 2023. Elements in muscle tissue of three dolphin species from the east coast of South Africa. Marine Pollution Bulletin, 188.
Plön, S., Andra, K., Auditore, L., Gegout, C., Hale, P., Hampe, O., Ramilo-Henry, M., Jaigirdar, A. M., Klein, L., Maewashe, K., Müssig, J., Ramsarup, N., Roussouw, N., Sabin, R., Shongwe, T., Tuddenham, P., Holm, P. 2024. Marine mammals as indicators of Anthropocene Ocean Health. npj Biodiversity 3, 24.
Plön S, Erbe C, Wintner S. 2020. Long-Term Demographic and Spatio-Temporal Trends of Indo-Pacific Bottlenose Dolphin (Tursiops aduncus) Bycatch in Bather Protection Nets off KwaZulu-Natal, South Africa. Frontiers in Marine Science 7:542675.
Potts WM, Götz A, James N. 2015. Review of the projected impacts of climate change on coastal fishes in southern Africa. Reviews in Fish Biology and Fisheries 25: 603–630.
Reeves, R.R., Smith, B.D., Crespo, E.A. and Notarbartolo di Sciara, G. 2003. Dolphins, Whales and Porpoises: 2002-2010 Conservation Action Plan for the World’s Cetaceans. IUCN, Gland, Switzerland and Cambridge, UK.
Reilly SB, Barlow J. 1986. Rates of increase in dolphin population size. Fishery Bulletin 84: 527–533.
Reisinger RR, Karczmarski L. 2010. Population size estimate of Indo-Pacific bottlenose dolphins in the Algoa Bay region, South Africa. Marine Mammal Science 26: 86–97.
Ross GJB, Cockcroft VG, Butterworth DS. 1987. Offshore distribution of bottlenosed dolphins in Natal coastal waters and Algoa Bay, Eastern Cape. South African Journal of Zoology 22: 50–56.
Ross GJB, Cockcroft VG, Melton DA, Butterworth DS. 1989. Population estimates for bottlenose dolphins Tursiops truncatus in Natal and Transkei waters. South African Journal of Marine Science 8: 119–129.
Ross, G. J. B. 1984. The smaller cetaceans of the south east coast of southern Africa. Annals of the Cape Provincial Museums (Natural History) 15: 173-410.
Ross GJ, Cockcroft VG. 1990. Comments on Australian bottlenose dolphins and the taxonomic status of Tursiops aduncus (Ehrenberg, 1832). The bottlenose dolphin. 101-28.
Särnblad A, Danbolt M, Dalen L, Amir OA, Berggren P. 2011. Phylogenetic placement and population structure of Indo‐Pacific bottlenose dolphins (Tursiops aduncus) off Zanzibar, Tanzania, based on mtDNA sequences. Marine Mammal Science 27(2):431-48.
Taylor, B.L., Chivers, S.J., Larese, J. and Perrin, W.F. 2007. Generation length and percent mature estimates for IUCN assessments of cetaceans. NOAA, Southwest Fisheries Science Center Administrative Report LJ-07-01. La Jolla, California.
Vargas-Fonseca OA, Kirkman SP, Conry D, Rishworth GM, Cockcroft V, Pistorius PA. 2018. Distribution and habitat use of Indo-Pacific bottlenose dolphins Tursiops aduncus along the south coast of South Africa. African Journal of Marine Science 40(4):439-50.
Vargas-Fonseca OA, Kirkman SP, Oosthuizen WC, Bouveroux T, Cockcroft V, Conry DS, Pistorius PA. 2020. Abundance of Indo-Pacific bottlenose dolphins (Tursiops aduncus) along the south coast of South Africa. Plos one 15(10):e0227085.
Vargas‐Fonseca OA, Yates P, Kirkman SP, Pistorius PA, Moore DM, Natoli A, Cockcroft V, Hoelzel AR. 2021. Population structure associated with bioregion and seasonal prey distribution for Indo‐Pacific bottlenose dolphins (Tursiops aduncus) in South Africa. Molecular Ecology 30(19):4642-59.
Wells RS, Rhinehart HL, Hansen LJ, Sweeney JC, Townsend FI, Stone R, Casper DR, Scott MD, Hohn AA, Rowles TK. 2004. Bottlenose dolphins as marine ecosystem sentinels: developing a health monitoring system. EcoHealth 1: 246-254.
Wells, R. S. and Scott, M. D. 2002. Bottlenose dolphins Tursiops truncatus and T. aduncus. In: W. F. Perrin, B. Wursig and J. G. M. Thewissen (eds), Encyclopedia of Marine Mammals, pp. 122-128. Academic Press.