

Humpback Whale
Megaptera novaeangliae

2025 Red list status
Megaptera novaeangliae

2025 Red list status
Regional Population
Trend
Change compared
to 2016
Overview
Megaptera novaeangliae – (Borowski, 1781)
ANIMALIA – CHORDATA – MAMMALIA – ARTIODACTYLA – BALAENOPTERIDAE – Megaptera – novaeangliae
Common Names: Humpback Whale, Bunch, Hump Whale, Hunchbacked Whale (English), Boggelrugwalvis (Afrikaans), Baleia jubarte (Portuguese), Baleine à bosse, Mégaptère (French), Ballena jorobada, Yubarta (Spanish; Castilian), Buckelwal (German), Hnúfubakur (Icelandic), Kit grbavec (Slovenian), Knølhval (Norwegian), Megattera (Italian), Pukkelhval (Danish)
Synonyms: Balaena novaeangliae Borowski, 1781
Taxonomic Note:
The Committee on Taxonomy of the Society for Marine Mammalogy recognises three subspecies of Humpback Whale: the nominate subspecies M. n. novaeangliae (Borowski, 1781) refers to the North Atlantic Humpback Whale; M. n. australis (Lesson, 1828) is the Southern (Hemisphere) Humpback Whale; and M. n. kuzira (Gray, 1850) is the North Pacific Humpback Whale (Committee on Taxonomy 2021). This is based on the finding that Humpback Whales in the three ocean basins, although not separate clades, appear to be on diverging genetic trajectories (Jackson et al. 2014).
Phylogenetic studies have shown that more or less geographically separated populations within different ocean basins reveal maternal lineages which can be identified across hemispheric boundaries, suggesting a degree of historic gene flow between hemispheres (Baker et al. 1994). No subspecies have been identified for this species. However, substantial population structure in the Southern Hemisphere is evident, and a number of breeding stocks have been identified based on the geographic position of their key breeding grounds. Two of these breeding stocks (Breeding Stocks B and C) migrate through coastal waters of the assessment region.
| Red List Status |
| Megaptera novaeangliae – LC – Least Concern
B2 subpopulation – VU – Vulnerable D1, (IUCN version 3.1) |
Assessment Information
Assessors: Wilkinson, C.1, Seyboth, E.1, Purdon, J.1,2, Shabangu, F.1,3, Plön, S.4, & da Silva, J.5
Reviewer: Vermeulen, E.1
Contributors: Smith, C.6 & Patel, T.6
Institutions: 1The Whale Unit, University of Pretoria, 2TUT Nature Conservation, 3Department of Forestry, Fisheries and the Environment, 4University of Cape Town, 5South African National Biodiversity Institute, 6Endangered Wildlife Trust
Previous Assessors: Barendse, J. & Carvalho, I.
Previous Reviewer: Child, M.F.
Previous Contributors: Relton, C., Findlay, K., Elwen, S., Meÿer, M., Oosthuizen, H. & Plön, S.
Assessment Rationale
The overall population of Humpback Whales is estimated to be increasing both globally and within the assessment region. For example, a Bayesian mixed model stock assessment for sub-stocks C1 and C2+3 estimated a post-2006 abundance of > 7,000 for each sub-stock, meaning that C1 is estimated at 85% of pristine level and C2+3 at 55% pristine (Johnston & Butterworth 2009). Similarly, shore-based surveys at Cape Vidal, KwaZulu-Natal Province, revealed a significant population increase between 9% and 11.5% from 1988 to 2002 (Findlay et al. 2011). This is very similar to increase rates of 11.4–12.2% calculated at the same site between 1988 and 1991, when the best population estimate in 1990 was 1,711 individuals (Findlay and Best 1996, Findlay et al. 2011). A more recent comparable study at Cape Vidal by Wilkinson et al. (2023) indicated that the population growth, although still increasing, has slowed down to between 7.4%-8.8% between 1988 and 2019. There are no major threats that are expected to cause population decline and there are estimated to be currently more than 1,500 mature individuals within the assessment region. Thus, we list this species as Least Concern in the assessment region.
However, the southern B2 subpopulation (assessed separately as they are largely localised to the Benguela system) is considered Vulnerable D1, due to subpopulation estimates of between 350 and 500 mature individuals in 2007, and recovery levels estimated to be much lower (< 15%) than most other Southern Hemisphere Humpback Whale populations. Without a historical baseline it is difficult to infer a recovery rate and population trend. However, the early depletion of Humpback Whales off the southwestern Cape by 1914 (1,299 individuals were taken between 1909–1916) and no recovery in numbers until full protection (in 1963) suggests that this does represent a unique sub-group of whales that show maternally-derived site fidelity to the Saldanha Bay/St Helena Bay coastal migratory corridor/feeding ground areas in the southern Benguela upwelling system. There is evidence of entanglements and incidental mortalities in the fisheries around these areas and although these kinds of events are unlikely to have a severe impact on the subpopulation, they should be monitored to ensure no population decline.
There are an estimated 140,000 individuals in the Southern Hemisphere, and they are considered widespread with no major threats at present. However, there is a growing concern about seismic activity relating to hydrocarbon exploration off West Africa, which can affect breeding behaviour, and this threat is probably also applicable in East Africa. In addition, there is the emerging threat of bulk sediment benthic phosphate mining off South Africa and Namibia, and the impacts of such activity on the ecosystem is yet unknown, but likely negative. Ship strikes and entanglements with fishing gear (Daniel 2022), combined with increasing population numbers, are becoming more frequent in South Africa. Finally, climate change poses one of the biggest threats overall to Humpback Whales (e.g. Meynecke et al. 2020). Tulloch et al. (2018) indicated through modelling that warming oceans will reduce prey availability of copepods and krill, resulting in increased interspecific competition between whale species. Another consequence of a decrease in prey availability is a drop in the reproductive success of the species (Seyboth et al. 2021).
Regional population effects: Humpback Whales are highly migratory and wide-ranging. There are no barriers to dispersal, thus rescue effects are possible.
Reasons for Change
Reason(s) for Change in Red List Category from the Previous Assessment: No change
Red List Index
Red List Index: No change
Recommended citation: Wilkinson C, Seyboth E, Purdon J, Shabangu F, Plön S & da Silva JM. 2025. A conservation assessment of Megaptera novaeangliae. In Patel T, Smith C, Roxburgh L, da Silva JM & Raimondo D, editors. The Red List of Mammals of South Africa, Eswatini and Lesotho. South African National Biodiversity Institute and Endangered Wildlife Trust, South Africa.
Regional Distribution and occurrence
Geographic Range
Humpback Whales occur worldwide, within all major ocean basins (Clapham and Mead 1999), migrating seasonally from tropical to polar waters. Most subpopulations, with the exception of the Arabian Sea subpopulation (Mikhalev 1997), migrate from tropical breeding areas (commonly along continental coastlines or sheltered islands) to temperate and high latitude feeding regions (Clapham and Mead 1999), where waters are colder and productivity increases. Humpback Whales are abundant throughout the Antarctic in summer south of the ice edge, but not within the pack ice zone (Dalla Rosa et al. 2008). In the winter, Southern Hemisphere Humpback Whales aggregate into specific nearshore breeding areas in the Atlantic, Indian and Pacific Oceans, with two subpopulations extending north of the equator off Colombia in the eastern Pacific and in the Bight of Benin in the Atlantic (van Waerebeek et al. 2001). Some wintering grounds are fairly localised (for example, around island groups) and some are more diffuse, such as along the western coast of southern Africa and the southern coast of West Africa (Reilly et al. 2008).
Currently, seven Humpback Whale breeding stocks (BSs) are recognised by the International Whaling Commission (IWC) in the Southern Hemisphere (IWC 1998). These are referred to BSs ‘A’ to ‘G’ by IWC and each is assigned to a specific breeding area. Based on genetic, mark-recapture or whaling data (Findlay 2001, Rosenbaum et al. 2009, Fleming and Jackson 2011), some stocks have been subdivided into sub-stocks, which are spatially and genetically isolated to varying degrees (Baker et al. 1994, Valsecchi et al. 1997). The breeding and feeding grounds used by each stock and sub-stock are: (BSA) east coast of South America the south-western Atlantic Ocean; Antarctic: 50°W–20°W; (BSB) west coast of Africa, being divided in B1 (Gabon) and B2 (western Namibia and South Africa); Antarctic: 20°W–10°E; (BSC) east coast of Africa and western Indian Ocean, divided in C1 (Mozambique), C2 (Comoros Archipelago), C3 (Madagascar), and C4 (Mascarene Islands); Antarctic: 60°E–120°E; (BSD) west coast of Australia; Antarctic: 60°E–120°E; (BSE) east coast of Australia and western Pacific Ocean, split in E1 (Australia), E2 (New Caledonia), E3 (Tonga); Antarctic: 120°E–170°W; (BSF) south central Pacific Ocean, divided in F1 (Cook Islands) and F2 (French Polynesia); Antarctic: 170°W–110°W; and (BSG) on the east coast of South America from northern Peru to Costa Rica; Antarctic: 110°W–50°W (IWC, 2007; Branch, 2011). Given the connectivity amongst sub-stocks from New Caledonia (E2), Tonga (E3), Cook Islands (F1) and French Polynesia (F2), they have been grouped in the so-called Oceania stock (IWC 2016).
Humpback Whales use South Africa’s coastal waters as migratory corridors, or as a summer feeding ground (BS B; Barendse et al. 2010). They are well studied in comparison to other Balaenopterid species, and, for most BSs, the migratory behaviour has been identified. Two of them utilise the waters around South Africa as wintering grounds:
- BS B (South–eastern Atlantic Ocean) is found along the west coast of Africa (Weir 2010, 2011) northwards to breeding grounds off West Africa (around Gabon; comprising sub-stock B1), as far as the Gulf of Guinea, and south to South Africa (a precise southerly limit has not been identified). A small component of BS B animals (designated as sub-stock B2) feeds within the Benguela upwelling (Angola, Namibia and South Africa) during spring and summer and some animals may remain in the area for prolonged periods (sometimes more than a month), rather than migrating directly to the Antarctic. The breeding ground of sub-stock B2 remains unknown.
- BS C (South-western Indian Ocean) is located along the eastern coasts of South Africa and Mozambique (sub-stock C1), as well as the eastern coasts of Madagascar (C3), Mayotte, the Comoros and other western Indian Ocean Island groups. The extent of mixing of the C sub-stocks remains unclear (Reilly et al. 2008).
Although some spatial or temporal mechanism appears to have caused some slight genetic differences between the sub-stock B2 and the broader population, they are not isolated, and genetic exchange does occur (Carvalho et al. 2014). There is also evidence of multiple returns of the same whales and their offspring to the west coast of Africa, suggesting maternally derived site fidelity (Barendse et al. 2013, Carvalho et al. 2014). The geographic extent of the feeding is not known but may extend throughout the southern Benguela, with bigger aggregations at prominent coastal upwelling plumes.
Since 2011, there have been reports of the formation of the so-called super-groups (feeding groups of “20 or more individuals of Humpback Whales estimated to be within five body lengths of their nearest neighbour”) in the area of the southern Benguela current (Findlay et al. 2017). Although it is still unknown which sub-stock forms these supergroups (likely a combination of B2 and C1), their annual presence in the area should be considered with regard to abundance estimates off the western coast of South Africa and in terms of anthropogenic impacts in this region (e.g. ship strikes and pollution) (Seyboth et al. 2025) as they use coastal areas near two ports, namely Saldanha Bay and Cape Town. The occurrence of these super-groups seems to be associated with oceanographic conditions, especially the combination of relatively high chlorophyll-a concentration in the month previous to their formation, in association with a decreased water export from the area, which may support productivity and prey availability for the whales in the area (Dey et al. 2021).
Elevation / Depth / Depth Zones
Elevation Lower Limit (in metres above sea level): (Not specified)
Elevation Upper Limit (in metres above sea level): (Not specified)
Depth Lower Limit (in metres below sea level): 616
Depth Upper Limit (in metres below sea level): 0
Depth Zone: Mesopelagic
Map
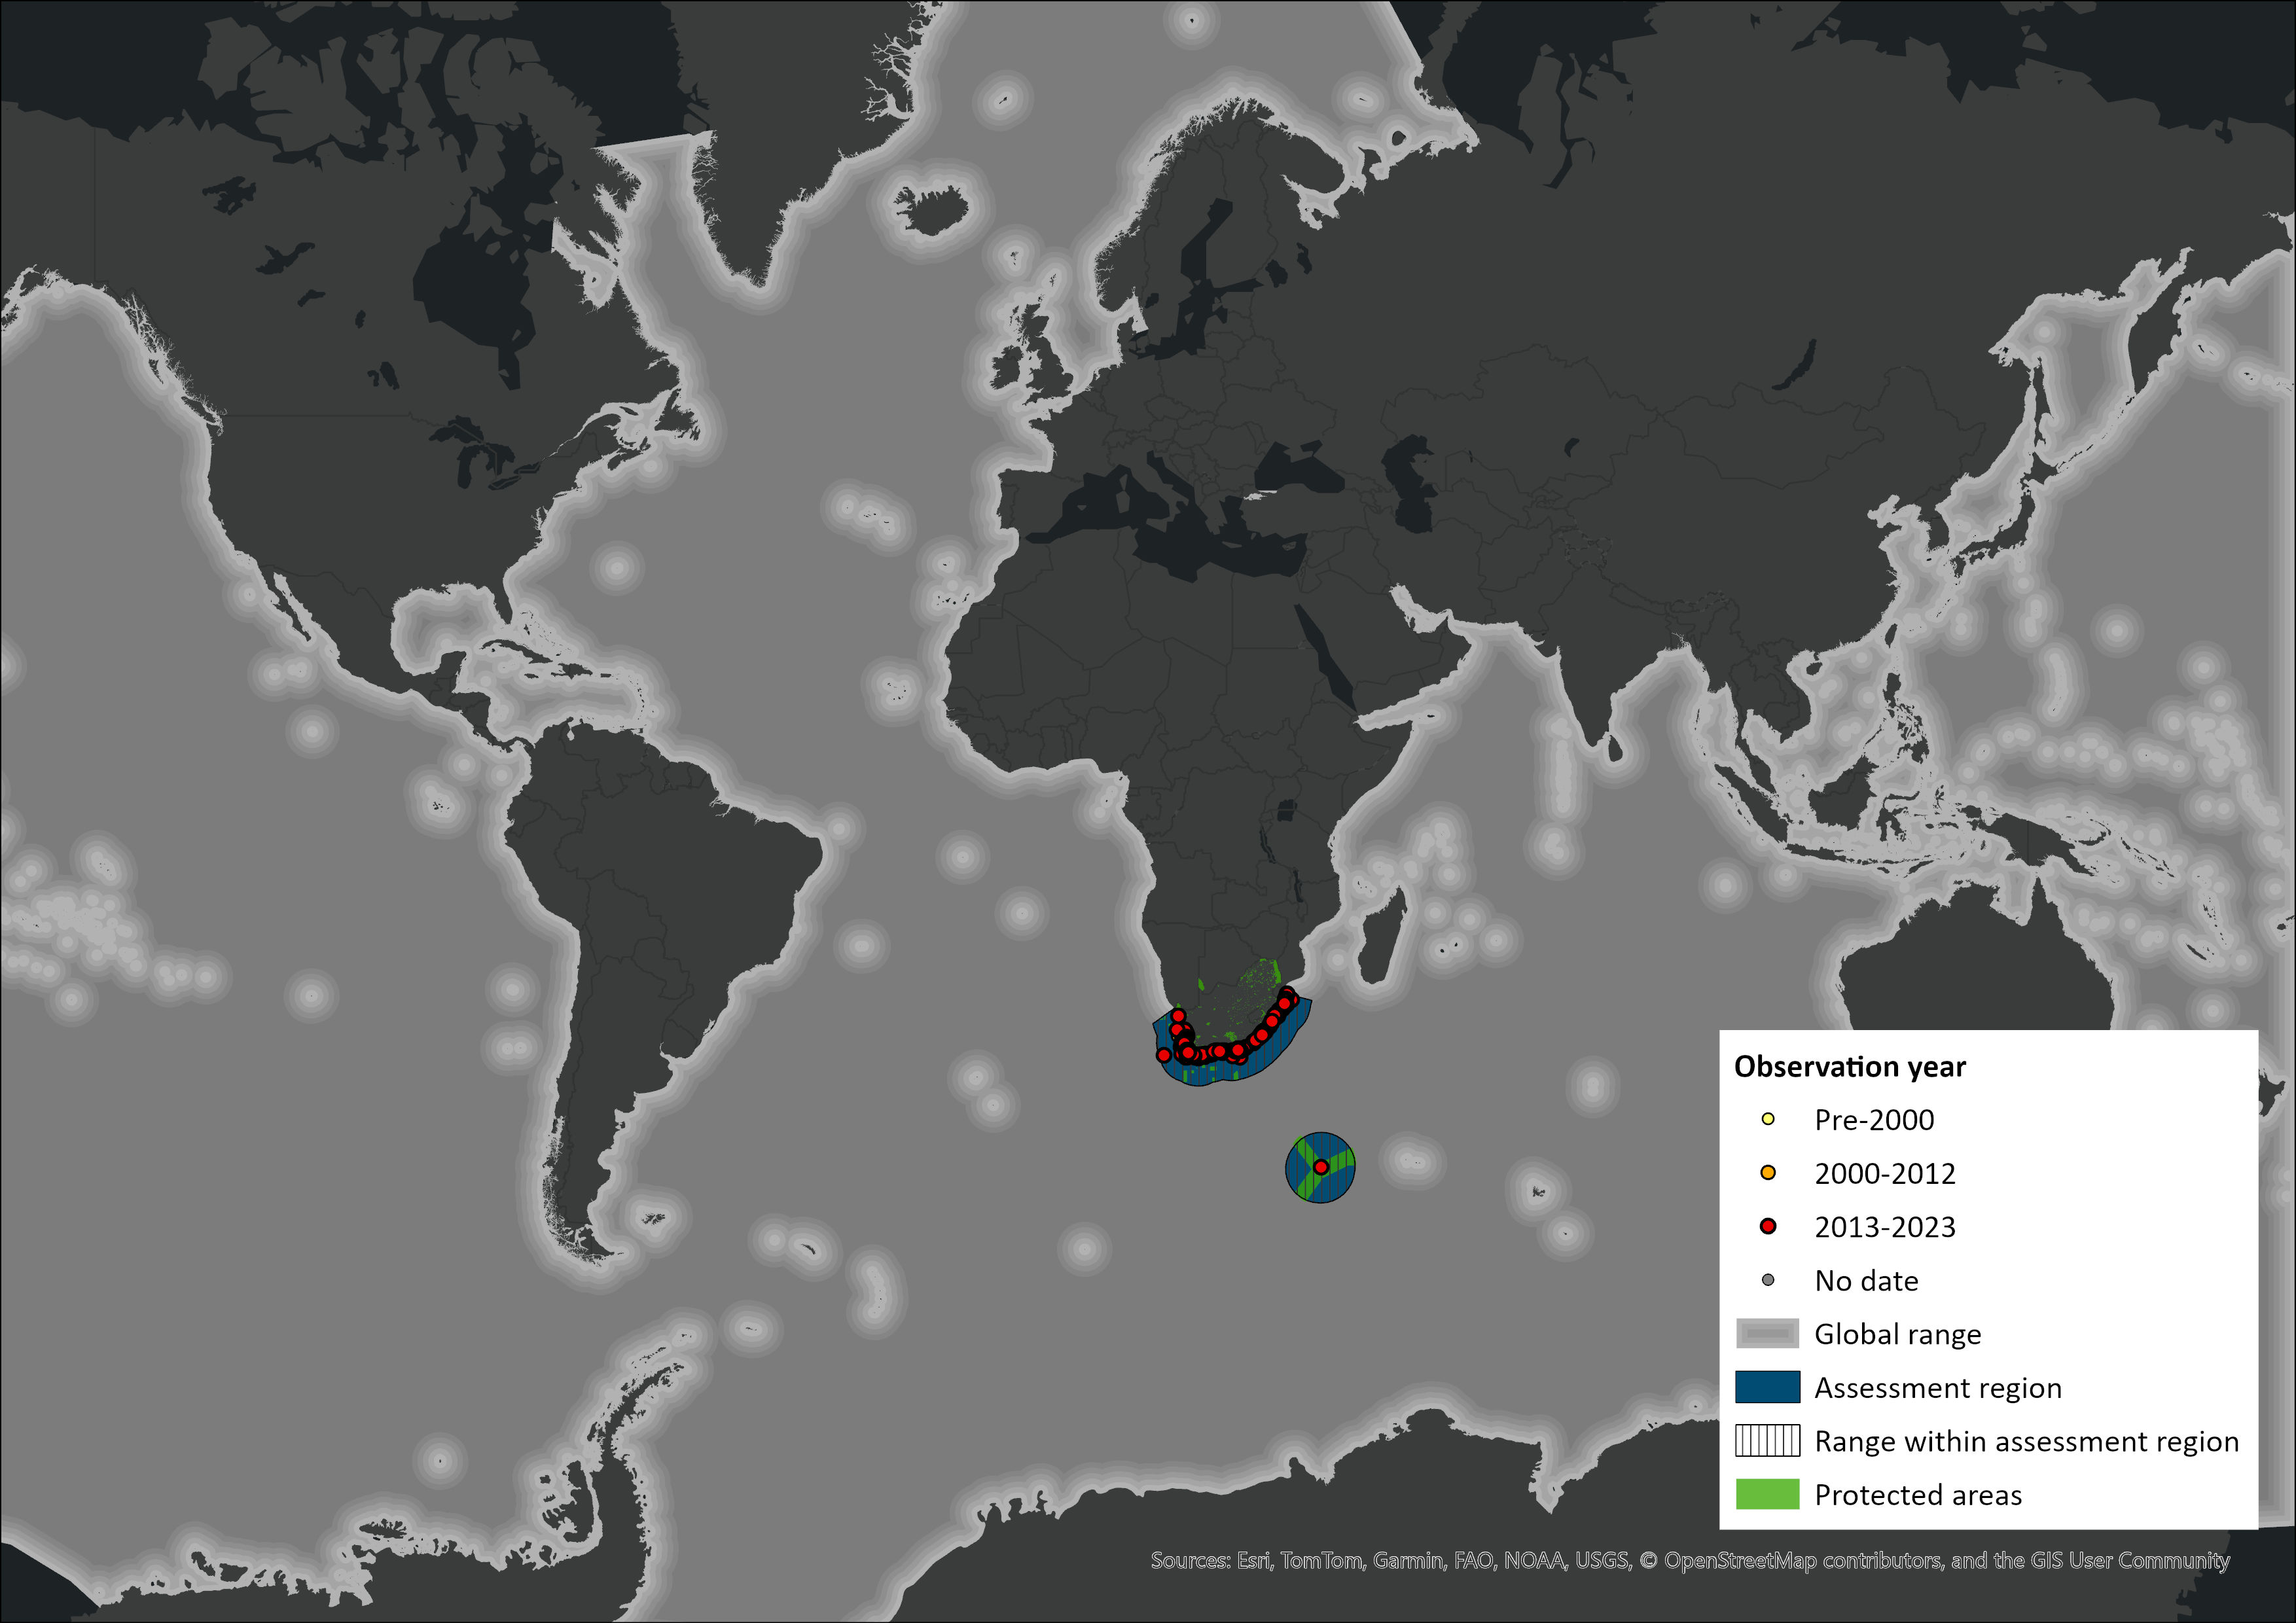 Figure 1. Distribution records for Humpback Whale (Megaptera novaeangliae) within the assessment region (South Africa, Eswatini and Lesotho). Note that distribution data is obtained from multiple sources and records have not all been individually verified.
Biogeographic Realms
Biogeographic Realm: Afrotropical, Antarctic, Australasian, Indomalayan, Nearctic, Neotropical, Oceanian, Palearctic
Occurrence
Countries of Occurrence
| Country | Presence | Origin | Formerly Bred | Seasonality |
| American Samoa | Extant | Native | – | – |
| Angola | Extant | Native | – | – |
| Anguilla | Extant | Native | – | – |
| Antigua and Barbuda | Extant | Native | – | – |
| Argentina | Extant | Native | – | – |
| Aruba | Extant | Native | – | – |
| Australia | Extant | Native | – | – |
| Bahamas | Extant | Native | – | – |
| Bangladesh | Extant | Native | – | – |
| Barbados | Extant | Native | – | – |
| Benin | Extant | Native | – | – |
| Bermuda | Extant | Native | – | – |
| Bonaire, Sint Eustatius and Saba | Extant | Native | – | – |
| Brazil | Extant | Native | – | – |
| Cabo Verde | Extant | Native | – | – |
| Cameroon | Extant | Native | – | – |
| Canada | Extant | Native | – | – |
| Cayman Islands | Extant | Native | – | – |
| Chile | Extant | Native | – | – |
| Cocos (Keeling) Islands | Extant | Native | – | – |
| Colombia | Extant | Native | – | – |
| Comoros | Extant | Native | – | – |
| Congo | Extant | Native | – | – |
| Congo, The Democratic Republic of the | Extant | Native | – | – |
| Cook Islands | Extant | Native | – | – |
| Costa Rica | Extant | Native | – | – |
| Cuba | Extant | Native | – | – |
| Curaçao | Extant | Native | – | – |
| Côte d’Ivoire | Extant | Native | – | – |
| Denmark | Extant | Native | – | – |
| Djibouti | Extant | Native | – | – |
| Dominica | Extant | Native | – | – |
| Dominican Republic | Extant | Native | – | – |
| Ecuador | Extant | Native | – | – |
| El Salvador | Extant | Native | – | – |
| Equatorial Guinea | Extant | Native | – | – |
| Falkland Islands (Malvinas) | Extant | Native | – | – |
| Faroe Islands | Extant | Native | – | – |
| Fiji | Extant | Native | – | – |
| France | Extant | Native | – | – |
| French Polynesia | Extant | Native | – | – |
| French Southern Territories | Extant | Native | – | – |
| Gabon | Extant | Native | – | – |
| Gambia | Extant | Native | – | – |
| Ghana | Extant | Native | – | – |
| Greenland | Extant | Native | – | – |
| Grenada | Extant | Native | – | – |
| Guadeloupe | Extant | Native | – | – |
| Guam | Extant | Native | – | – |
| Guatemala | Extant | Native | – | – |
| Haiti | Extant | Native | – | – |
| Honduras | Extant | Native | – | – |
| Iceland | Extant | Native | – | – |
| India | Extant | Native | – | – |
| Indonesia | Extant | Native | – | – |
| Iran, Islamic Republic of | Extant | Native | – | – |
| Ireland | Extant | Native | – | – |
| Jamaica | Extant | Native | – | – |
| Japan | Extant | Native | – | – |
| Kenya | Extant | Native | – | – |
| Kiribati | Extant | Native | – | – |
| Korea, Democratic People’s Republic of | Extant | Native | – | – |
| Korea, Republic of | Extant | Native | – | – |
| Madagascar | Extant | Native | – | – |
| Malaysia | Extant | Native | – | – |
| Maldives | Extant | Native | – | – |
| Marshall Islands | Extant | Native | – | – |
| Martinique | Extant | Native | – | – |
| Mauritania | Extant | Native | – | – |
| Mauritius | Extant | Native | – | – |
| Mexico | Extant | Native | – | – |
| Montserrat | Extant | Native | – | – |
| Morocco | Extant | Native | – | – |
| Mozambique | Extant | Native | – | – |
| Myanmar | Extant | Native | – | – |
| Namibia | Extant | Native | – | – |
| Nauru | Extant | Native | – | – |
| New Caledonia | Extant | Native | – | – |
| New Zealand | Extant | Native | – | – |
| Nicaragua | Extant | Native | – | – |
| Nigeria | Extant | Native | – | – |
| Niue | Extant | Native | – | – |
| Northern Mariana Islands | Extant | Native | – | – |
| Norway | Extant | Native | – | – |
| Oman | Extant | Native | – | – |
| Pakistan | Extant | Native | – | – |
| Palau | Extant | Native | – | – |
| Panama | Extant | Native | – | – |
| Papua New Guinea | Extant | Native | – | – |
| Peru | Extant | Native | – | – |
| Philippines | Extant | Native | – | – |
| Pitcairn | Extant | Native | – | – |
| Portugal | Extant | Native | – | – |
| Puerto Rico | Extant | Native | – | – |
| Russian Federation | Extant | Native | – | – |
| Réunion | Extant | Native | – | – |
| Saint Barthélemy | Extant | Native | – | – |
| Saint Helena, Ascension and Tristan da Cunha | Extant | Native | – | – |
| Saint Helena, Ascension and Tristan da Cunha -> Tristan da Cunha | Extant | Native | – | – |
| Saint Kitts and Nevis | Extant | Native | – | – |
| Saint Lucia | Extant | Native | – | – |
| Saint Martin (French part) | Extant | Native | – | – |
| Saint Pierre and Miquelon | Extant | Native | – | – |
| Saint Vincent and the Grenadines | Extant | Native | – | – |
| Samoa | Extant | Native | – | – |
| Sao Tome and Principe | Extant | Native | – | – |
| Senegal | Extant | Native | – | – |
| Seychelles | Extant | Native | – | – |
| Sint Maarten (Dutch part) | Extant | Native | – | – |
| Solomon Islands | Extant | Native | – | – |
| Somalia | Extant | Native | – | – |
| South Africa | Extant | Native | – | – |
| South Georgia and the South Sandwich Islands | Extant | Native | – | – |
| Spain | Extant | Native | – | – |
| Sri Lanka | Extant | Native | – | – |
| Taiwan, Province of China | Extant | Native | – | – |
| Tanzania, United Republic of | Extant | Native | – | – |
| Timor-Leste | Extant | Native | – | – |
| Togo | Extant | Native | – | – |
| Tonga | Extant | Native | – | – |
| Trinidad and Tobago | Extant | Native | – | – |
| Tunisia | Extant | Native | – | – |
| Turks and Caicos Islands | Extant | Native | – | – |
| Tuvalu | Extant | Native | – | – |
| United Arab Emirates | Extant | Native | – | – |
| United Kingdom of Great Britain and Northern Ireland | Extant | Native | – | – |
| United States of America | Extant | Native | – | – |
| Uruguay | Extant | Native | – | – |
| Vanuatu | Extant | Native | – | – |
| Venezuela, Bolivarian Republic of | Extant | Native | – | – |
| Viet Nam | Extant | Native | – | – |
| Virgin Islands, British | Extant | Native | – | – |
| Virgin Islands, U.S. | Extant | Native | – | – |
| Wallis and Futuna | Extant | Native | – | – |
| Western Sahara | Extant | Native | – | – |
| Yemen | Extant | Native | – | – |
Large Marine Ecosystems (LME) Occurrence
Large Marine Ecosystems: (Not specified)
FAO Area Occurrence
| Presence | Origin | Formerly Bred | Seasonality | |
| 18. Arctic Sea | Extant | Native | – | – |
| 21. Atlantic – northwest | Extant | Native | – | – |
| 27. Atlantic – northeast | Extant | Native | – | – |
| 31. Atlantic – western central | Extant | Native | – | – |
| 34. Atlantic – eastern central | Extant | Native | – | – |
| 41. Atlantic – southwest | Extant | Native | – | – |
| 47. Atlantic – southeast | Extant | Native | – | – |
| 48. Atlantic – Antarctic | Extant | Native | – | – |
| 51. Indian Ocean – western | Extant | Native | – | – |
| 57. Indian Ocean – eastern | Extant | Native | – | – |
| 58. Indian Ocean – Antarctic | Extant | Native | – | – |
| 61. Pacific – northwest | Extant | Native | – | – |
| 67. Pacific – northeast | Extant | Native | – | – |
| 71. Pacific – western central | Extant | Native | – | – |
| 77. Pacific – eastern central | Extant | Native | – | – |
| 81. Pacific – southwest | Extant | Native | – | – |
| 87. Pacific – southeast | Extant | Native | – | – |
| 88. Pacific – Antarctic | Extant | Native | – | – |
Climate change
Climate change can be considered one of the main threats to Humpback Whales (Meynecke et al. 2020), with the potential full recovery of the BSs from whaling subjected to it (Tulloch et al. 2019). Changes in the species’ timing of migration (Ramp et al. 2015), reproductive success (Seyboth et al. 2021) have been observed, and an influence on its migratory routes can also occur (Meynecke et al. 2020). One of the main influences come from the changes that climate change has on prey availability (mainly Antarctic krill, Euphausia superba) (e.g. Hill et al. 2019) for the individuals in the feeding grounds, with consequences for their body condition (e.g. Bengtson Nash et al. 2018), and then to reproduction output, migration, etc. In the case of the sub-stock B2, climate change can possibly influence food availability along the coast of western Africa, with a likely influence in the distribution and abundance of the species in the area.
Climatic phenomena such as El Niño and La Niña and increases in wind conditions favourable to upwelling have been associated with changes in the primary productivity in the area (Rouault et al. 2010, Hutchings et al. 2012, Verheye et al. 2016). Given the complexity of the influence of these changes on the secondary productivity on the area (Dey et al. 2021), and the fact that this influence can vary in space and time (Rouault and Tomety 2022), their consequences for whales’ prey availability are unknown. It is predicted that extreme climatic events will become stronger and more frequent (Cai et al. 2014), which might impose additional changes in the Benguela upwelling system, potentially influencing the occurrence of whales in the area, and on the formation of super-groups.
There have been discussions on the contribution of different species of whales, including Humpback Whales to the capture of dioxide carbon (CO2) from the atmosphere to the ocean, which some argue to be a potential contribution of whales against depleting effects of climate change. While some researchers state that such contribution can be significant (e.g. Lavery et al. 2010, 2014, Pershing et al. 2010, Roman et al. 2014), others believe it should be considered with care as the influence can be limited and, in general, not significant at global levels (Meynecke et al. 2023, Pearson et al. 2023). Therefore, more studies are needed for the assessment of the influence of whale-stimulated CO2 sequestration via its influence on primary productivity, for the area used by humpback whale super-groups.
Population information
Humpback Whale stocks were heavily depleted throughout most of the Southern Hemisphere in the early 20th century by a combination of coastal catches in their wintering grounds, catches from land stations, and by pelagic fleets in their Antarctic feeding grounds (e.g. Findlay 2000). Approximately 220,000 Humpback Whales were taken in total, of which about 100,000 were killed since 1940 (Allison 2006). Almost half of these consisted of illegal takes by the USSR (Zemsky et al. 1996, Allison 2006). Between 1908 and 1963, recorded catches outside the Antarctic (north of 40°S) included about 30,000 off the western coast of Africa (primarily Gabon and Angola), and nearly 20,000 off the eastern coasts of southern Africa (KwaZulu-Natal, Mozambique and Madagascar) and in the western Indian Ocean. For Humpback Whales in the South Atlantic, western and northern Indian Oceans, there is a strong population structure between BSs A, B, C and X (Rosenbaum et al. 2009) and evidence of some substructure within these BSs, with subunits that are spatially and genetically isolated to varying degrees. There have been records of whales “switching” between the Indian and Atlantic Ocean wintering grounds, but this is regarded as highly unusual (Pomilla and Rosenbaum 2005, Stevick et al. 2011).
Recent estimates of abundance for the majority of BSs have been acquired using line-transect surveys as well as photographic identification capture-recapture methods. The rate of increase in abundance has been identified from time-series data. For five of these stocks, a rate of increase between 4.5% and 10.5% per year has been revealed (Leaper et al. 2008). The Southern Hemisphere estimate of 140,000 individuals (Jackson et al. 2015) is probably an underestimate, because there is currently no data for BS F (South Pacific), or part of BS B’s winter range for a discrete period. Additionally, the entire population does not always migrate to the wintering grounds, for example, results revealed an excess of males during a winter census (Reilly et al. 2008).
South of 60°S, in the Antarctic, summer estimates of abundance have been conducted by the International Decade of Cetacean Research, IDCR (later named Southern Ocean Whale and Ecosystem Research, SOWER). Since 1978 and 1979, three sets of circumpolar surveys have been completed, revealing abundance estimates of 7,100 (1978–1984), 10,200 (1985–1991), and 41,800 (1992–2004). These are likely to be underestimates of the Southern Hemisphere population, due to the fact that not all individuals migrate south of 60°S, and a large proportion of key summer feeding grounds north of this limit have not been assessed (for example South Georgia, the South Sandwich Islands and the waters around Bouvet Island).
In the Indian Ocean, 8,000 Humpback Whales were reportedly caught from BS C off South Africa and Mozambique between 1908 and 1915. Smaller catches took place off the KwaZulu-Natal coastline from 1920 to 1962, but significantly larger catches off Madagascar took place during two periods between 1937–1939 and 1949–1950 (Angot 1951). A certain degree of whaling in and around the Antarctic region during the peak whaling period also may have affected BS C, which is believed to be well recovered since the end of commercial whaling (Wilkinson et al. 2023). IWC models suggest recovery of 65–96% pre-exploitation levels for the C1 stock, and Findlay et al. (2011), using shore-based surveys at Cape Vidal, calculated a significant population increase between 9% and 11.5% from 1988 to 2002. This is very similar to increase rates calculated at the same site between 1988 and 1991: 11.4–12.2%, with the best population estimate in 1990 being 1,711 individuals (Findlay and Best 1996). These figures have recently been updated by Wilkinson et al. (2023) at Cape Vidal using the same methodology as Findlay et al. (2011). Wilkinson et al. (2023) estimated Humpback Whale recovery to have slowed down to between 7.4% and 8.8% between the years of 1988 and 2019. In 2018, their estimate was 10,499 and in 2019 their estimate was 11,009. These figures, although still increasing, are lower than previous estimates, suggesting that humpback whale population recovery is nearing its pre-whaling numbers or that other factors, such as climate change, are at play. The population in the SW Indian Ocean is probably nearing carrying capacity and the rate of increase is expected to slow down (Findlay et al. 2011). Johnston and Butterworth (2009), using a Bayesian mixed model stock assessment for sub-stocks C1 and C2+3, calculated a post-2006 abundance of > 7,000 each, meaning that C1 is estimated at 85% of pristine level and C2+3 at 55% pristine.
BS B declined considerably in the 19th and 20th centuries as a direct result of whaling in its wintering breeding grounds off the west coast of Africa. Between 1909 and 1960, approximately 30,000 Humpback Whales were documented as caught off the west coast of sub-Saharan Africa (Reilly et al. 2008). The most recent large Humpback whaling operation by Norwegian and French whalers in the waters off Gabon and São Tomé took more than 4,000 individuals between 1951 and 1954, and subsequently 160 were caught off Gabon in 1959 in a final commercial whaling operation. The population dynamics of BS B are largely uncertain, and although numbers may have increased somewhat, it is a unique assemblage, and fairly localised around a critical habitat (southern Benguela upwelling). Based on genetic dissimilarities, some suggest that two sub-stocks exist: specifically, B1 that spends the winter off the west coast of Gabon, the Congo, Cabinda (Angola) and northwards to the Bight of Benin; and B2 with a wintering area that is currently uncertain, although may be south of that of B1 (Best 2011). Individuals off Namibia’s west coast have not shown matches with any other site (Elwen et al. 2014), thus supporting the existence of sub-stock B2. There are also records of Humpback Whales during summer near Cape Verde (Hazevoet et al. 2011), but it is not clear how these relate to the greater BS. Movements of 11 individuals that were tracked during migrations from West Africa to Gabon indicate that these stocks are not reproductively isolated (Barendse et al. 2011, Carvalho et al. 2014).
The complex population structure of BS B and lack of data collected from the area between Walvis Bay and northern Angola has hampered accurate overall population estimates. The most recent estimate based on capture-recapture models for data collected from 2001–2007 of whales making use of the feeding ground along the west coast is about 500 animals (Barendse et al. 2011). Without a historical baseline it is difficult to infer a recovery rate. However, the early depletion of Humpback Whales off the southwestern Cape by 1914 (1,299 were taken between 1909 and 1916) and no recovery in numbers (Best and Allison 2010) up to full protection in 1963 suggests that this does represent a unique sub-group of whales that show maternally derived site fidelity to the Saldanha Bay/St Helena Bay coastal migratory corridor/feeding ground areas (Barendse et al. 2013). Other Humpback Whales from Gabon make use of more offshore migratory routes (Rosenbaum et al. 2014). Modelling done for IWC, based on historic catches and capture-recapture, suggests that for sub stock B2 the estimated abundance relative to pristine levels may be between 4.5–12.4%, but there is much uncertainty about which model configuration is appropriate (Müller et al. 2011). This uncertainty has not changed much with the most recent synthesis (Jackson et al. 2015).
Humpback Whales are better studied than other Balaenopterid species and migratory destinations are well known for some subpopulations. The IWC Scientific Committee suggests that globally Humpback Whale stocks have generally recovered to levels at or above those of their 1940 abundance. However, the IWC is yet to assess populations in the North Pacific and four of the seven Southern Hemisphere BSs, thus it is currently not possible to accurately compare the global population level to that of the historic 1940 level. However, there is little evidence to suggest that the global population remains below 50% of the 1940 threshold.
Current population trend: The broad population of M. novaeangliae is considered to be increasing; however, the subpopulation B2 is currently considered stable.
Continuing decline in mature individuals: No
Number of mature individuals in population: The southern hemisphere estimate of 140,000 is probably an underestimate. Subpopulation B2 is currently estimated at between 350 and 500 individuals.
Number of mature individuals in largest subpopulation: Unknown
Number of subpopulations: Currently two subpopulations (B and C) have been identified migrating through South African waters, which have been further divided into sub-stocks based on genetic dissimilarities.
Severely fragmented: No
Extreme fluctuations in the number of subpopulations: (Not specified)
Continuing decline in number of subpopulations: (Not specified)
All individuals in one subpopulation: (Not specified)
Quantitative Analysis
Probability of extinction in the wild within 3 generations or 10 years, whichever is longer, maximum 100 years: (Not specified)
Probability of extinction in the wild within 5 generations or 20 years, whichever is longer, maximum 100 years: (Not specified)
Probability of extinction in the wild within 100 years: (Not specified)
Population genetics
Humpback Whales have a complex population structure. Different groups of Humpback Whales, which are more or less geographically separated, exist in different ocean basins, resulting in little to no genetic interchange between groups, especially between in the Northern and Southern Hemispheres due to limited trans-equatorial movement. Demographic, photographic and genetic evidence support boundaries that differentiate humpback whale stocks (Rayne 1940; Chittleborough 1965; IWC 1996, 2007; Rosenbaum et al. 2009; Cypriano-Souza et al. 2017; Kershaw et al. 2017; Neveceralova et al. 2022); however, there are increasing accounts of whales undertaking long-distance migrations between the breeding grounds and feeding grounds of different stocks (e.g., Stevick et al. 2014; Avecedo et al. 2021; Macondes et al. 2021).
Within South African waters, BS B2 and C are known to exist. Despite some genetic investigation, an exploration of the effective population sizes within each of these BS has not been undertaken. However, based on an Ne/Nc conversion ratio for the southwestern Atlantic Ocean population of 0.28 (Nc being 3.6 times larger than Ne; Cypriano-Souza et al. 2018) and current population size estimates for substock B2 (350- 500 mature individuals), Ne for this sub-stock is estimated at 97-139 individuals. If the perceived super-groups comprised of individuals from multiple sub-stocks exist (e.g., B2 and C1 as reported above), then the estimated Ne is likely to be larger. Until a more comprehensive investigation of the population genetic structure and diversity is undertaken within regional waters, these estimates could suggest the sub-stock is in a vulnerable situation.
Habitats and ecology
Humpback Whales generally migrate seasonally between winter breeding grounds in the tropics and feeding areas predominantly along continental shelves in temperate and high latitude areas (Clapham 2002). In the Austral summer, Humpback Whales feed nearly exclusively on Antarctic krill, usually around Antarctica (Skinner and Chimimba 2005). However, some feeding activity takes place in the Benguela upwelling system along the migration route west of Africa by BS B (Best et al. 1995), where Humpback Whales consume another krill species (E. lucens) and the amphipod Themisto gaudichaudii (Barendse et al. 2011). The feeding here appears to be linked to productive upwelling cells at Cape Point, Dassen Island, Cape Columbine, and probably others further north. There is evidence that “knowledge” about the use of the feeding opportunities is transferred by mothers to their calves (Barendse et al. 2013), and whales from BS B2 demonstrate high fidelity to the region (Barendse et al. 2013, Carvalho et al. 2014), with several animals returning to the region between years and for long periods of time. The relationship between whales feeding here and whales migrating along mid-oceanic routes has not been established. Recent work looking at scarring by cookie-cutter sharks (Isistius spp.) suggests that whales found off the west coast of South Africa have spent extended periods in nearshore or cooler waters where wounds (acquired in warmer tropical waters) have had time to heal (Elwen et al. 2014). Feeding at Saldanha Bay and St Helena Bay occurs mainly from October to February, although whales may be present in low numbers throughout the year.
For the broad population, the bulk of their feeding takes place in summer around Antarctica, where the major food source is krill. This resulting energy is converted to reserves in the form of blubber. In some areas outside of their summer feeding zones, Humpback Whales may feed on schooling fish, but they usually only consume limited amounts of food while migrating northwards, and on return to the south. In Durban, Bannister and Baker (1967) examined the stomach contents of 25 Humpback Whales; only three of the whales were found to have food in their stomachs, all of which consisted of Euphasiid remnants.
The inshore area associated with the Benguela upwelling (from the coast to about 70 m depth) is used regularly as a feeding area in the spring and summer months by a sub-group of Humpback Whales (likely mix of sub-stock B2 and C1). Feeding aggregations form of over 200 whales at a time, with more recent evidence of “super-groups” present in the region (Findlay et al. 2017). Some of the whales may remain in the area for over a month. They are associated with upwelling plumes at Cape Columbine, Dassen Island, Cape Point, Lamberts Bay, Elands Bay and possibly also Lüderitz, but are known to be absent from Saldanha Bay and St Helena Bay. Findlay and Best (1996), as a first observation, reported that individuals of the sub-stock B2 may feed opportunistically off the west coast of South Africa during the summer, where one individual was found to have been feeding on stomatopods. However, to-date, there is no documented confirmed mixing.
In the Southern Hemisphere, Humpback Whales will reproduce during the winter months in tropical, coastal waters. With a gestation period of approximately 11.5 months, females usually give birth every two years but may reproduce annually (Schmidly & Bradley 2016). Calves grow very quickly and usually reach lengths of 8.8 m by the time of weaning. Mehta et al. (2007) reported that Humpback Whale calves may be subject to predation by Killer Whales (Orcinus orca). Males and females become sexually mature once they reach lengths of 11.5 m and 12 m, respectively (Skinner and Chimimba 2005). Humpback Whales have a generation time of 22 years (Taylor et al. 2007). This species is known to be extremely vocal at breeding grounds, where they produce a sequence of diverse sounds for durations of between 8 and 30 minutes. Using these sounds, Shabangu and Kaworski (2022) found that Humpback whales sing off the west coast of South Africa from July through December, with a peak calling in September/October. Around the Prince Edward Islands, Humpback Whale songs are detected almost year-round with high singing levels in winter and spring (Shabangu et al. 2024). Sequences are consistent between individuals at particular breeding grounds, and most commonly come from breeding adult males, announcing their presence (Skinner and Chimimba 2005). Furthermore, these sounds are also produced during feeding (Gridley et al. 2018).
Ecosystem and cultural services: As indicator species, marine mammals integrate and reflect ecological variation across large spatial and long temporal scales, and therefore they are prime sentinels of marine ecosystem change; migratory mysticete whales may be used to investigate broadscale shifts in ecosystems (Moore 2008).
The B2 sub-stock has been considered a flagship population due to the presence of a coastal Humpback Whale feeding ground located markedly north of the species’ typical Southern Ocean foraging areas, a pattern regarded as atypical for the species (Barendse et al. 2013). Recent findings, however, indicate that individuals from both the B2 and C1 populations co-occur and feed at this site, underscoring its significance as a shared, ecologically important habitat. It offers special research and tourism opportunities. As previously mentioned in this document, super-groups of Humpback Whales have been observed annually on the west coast of South Africa (Findlay et al. 2017), probably taking advantage of increased productivity in the area given certain oceanographic conditions (Dey et al. 2021).
IUCN Habitats Classification Scheme
| Habitat | Season | Suitability | Major Importance? |
| 9.1. Marine Neritic -> Marine Neritic – Pelagic | – | Suitable | Yes |
| 10.1. Marine Oceanic -> Marine Oceanic – Epipelagic (0-200m) | – | Suitable | Yes |
Life History
Generation Length: 22 years
Age at Maturity: Female or unspecified: 4-5 years
Age at Maturity: Male: 4-5 years
Size at Maturity (in cms): Female: 117 cm
Size at Maturity (in cms): Male: 112 cm
Longevity: 20 years
Average Reproductive Age: 4-5 years
Maximum Size: Feale (in cms): 131 cm
Maximum Size: Male (in cms): 135 cm
Size at Birth (in cms): 396 – 457 cm
Gestation Time: 10-13 months
Reproductive Periodicity: 1-2 years
Average Annual Fecundity or Litter Size: 0.5
Natural Mortality: (Not specified)
Breeding Strategy
Does the species lay eggs? No
Does the species give birth to live young? Yes
Does the species exhibit parthenogenesis? No
Does the species have a free-living larval stage? No
Does the species require water for breeding? Yes
Movement Patterns
Movement Patterns: Migratory
Congregatory: Yes, over 200 whales
Systems
System: Marine
General Use and Trade Information
Large-scale harvesting of this species has ceased. Low-level hunting continues in a few places, but not specifically in the assessment area. For example, the government of Japan announced plans to resume Humpback whaling in the Antarctic from the 2007/08 season, starting with an experimental catch of 50 animals per year under scientific permit. The impact of these catches on small unrecovered stocks of Humpback Whales in Oceania that feed in the whaling grounds of Area V is not clear. Humpback Whale blubber and baleen were used for products, such as lamp oil, margarine, cooking oil, candles, soaps, cosmetics, corsets, umbrellas and tennis racquets, while whale meat was sold for human consumption, animal feed and fertiliser.
Shore-based whale watching in South Africa in 1995 delivered an estimated R5 million in indirect expenditure (Findlay 1997). In 2008, it was estimated that there were > 500,000 whale watchers in South Africa spending > 2.7 million $US directly and > 58.7 million $US indirectly (O’Connor et al. 2009). Boat-based whale watching increased by 14% between 1998 and 2008. Whale watching based on Humpbacks becomes more important during the migration off the KwaZulu-Natal coast.
| Subsistence: | Rationale: | Local Commercial: | Further detail including information on economic value if available: |
| Yes | – | – | – |
National Commercial Value: Yes
International Commercial Value: No
| End Use | Subsistence | National | International | Other (please specify) |
| 1. Food – human | true | true | – | – |
| 15. Sport hunting/specimen collecting | – | true | – | – |
Is there harvest from captive/cultivated sources of this species? No
Harvest Trend Comments: (Not specified)
Threats
In the Southern Hemisphere overall, there are an estimated 140,000 individuals and they are considered widespread with no major threats at present (Jackson et al. 2015). While commercial whaling had a severely detrimental impact on Humpback Whale populations, since the banning of Humpback whaling in 1966, the global population has shown a significant recovery. There are, however, several small-scale populations that have not exhibited this increasing trend, such as the B2 stock.
Like other cetaceans, Humpback Whales are vulnerable to injury and death as a result of ship strikes, and are the second most commonly recorded victims of ship strikes globally (Fleming and Jackson 2011). In the US Atlantic, between 1999 and 2003, seven Humpback Whales were reported seriously injured or killed as a result of ship strikes (Fleming and Jackson 2011). Purdon et al (2020) found that out of 14 anthropogenic stressors studied, shipping was the biggest threat to species richness in the assessment area. Shipping not only causes physical injury to Humpback Whales, but the noise produced by it can also affect them by disrupting their behaviour and communication (Shabangu et al. 2022). A study by Blair et al. (2016) found that elevated shipping levels significantly affect foraging Humpback Whales. Shipping density is high along the south coast of South Africa (Figure 1) and this could affect the super-group phenomena and displace them from those feeding grounds. In the assessment area, there have been 12 confirmed deaths of Humpback Whales attributed to ship strikes since 2011 (MRI Whale Unit unpublished data). There may be many more deaths due to ship strikes but are possibly not recorded or confirmed.
Between 1999 and 2003, 19 Humpback Whales were seriously injured or killed due to entanglements in the US Atlantic (Fleming and Jackson 2011). In the US Pacific (mostly Alaska) between 1999 and 2001, 13 Humpback Whales were documented as seriously injured or killed as a result of entanglements (Fleming and Jackson 2011).
Within the assessment region, Humpback Whales are occasionally caught in shark nets off the KwaZulu-Natal coast. Entanglement incidents of Humpback Whales in shark nets off the KwaZulu-Natal coast showed an increase of 15.1% per annum between 1990 and 2009 (Meÿer et al. 2011). Considering that this rate of increase is comparable to that of the increase in Humpback Whale populations, the risk of entanglement is not considered to be a major concern (Meÿer et al.2011). Between 2011 and 2022, 13 humpback whales stranded due to entanglement in fishing gear in the assessment region (MRI Whale Unit unpublished data). Since 2019, KZN Sharks Board, has introduced mitigation measures for whales migrating past their coastal bather safety shark nets. This was achieved by removing the nets (between June and November) at most of their protected bather beaches, during times of intense whale activity. This has resulted in a reduced risk to migrating whales passing their bather safety protection nets. The nets removed were then replaced by drum lines, as these are less likely to entangle passing whales. These mitigation measures have resulted in no entanglements being reported in KZN Sharks Board nets during the reporting period 1st April 2022 to 31st March 2023, while continuing to maintain bather safety (SAWDN 2023). In the majority of regions, the recent increase in Humpback Whale abundance suggests that anthropogenic disturbance and the resulting mortalities do not detrimentally impact population trends. However, a continued increase in whale numbers is expected to result in heightened levels of anthropogenic interaction, thus effective mitigation measures are necessary.
This species may become entangled in trap fisheries and rock lobster traps off the Western Cape, South Africa. Although increases in entanglements are again considered a possible result of increasing population numbers, entanglements may also be impacting the small subpopulation that frequents the west coast in spring and summer. The B2 sub-stock distribution overlaps with rock lobster offshore fisheries along the west coast of South Africa. For example, Dassen Island is a specific hotspot. These fisheries are, however, managed spatially and temporally by an Operational Management Procedure, thus are not stagnant in their positioning and effect on the marine environment. Although there is evidence of entanglements and incidental mortalities at these fisheries, they are not considered a major threat, but should be monitored accordingly, considering that these smaller subpopulations have not exhibited clear increases in their abundance levels, and thus should still be carefully monitored. A recent study looked at the risks involved between Humpback Whales and 6 different types of fishing; small pelagic trawl, pole tuna, pelagic longline, offshore trawl, line fishing and inshore trawl (Grobbler 2025). Results showed that line fishing and small pelagic fisheries pose the highest risk to Humpback Whales as their distribution overlaps with more than 50% of each of these fishery types.
Energy development is also suspected to be a minor threat. Considering that South African Humpback Whale migrate, and have been known to travel through oil and gas fields off South Africa, Namibia, Angola, Equatorial Guinea and the Congo, threats outside of the assessment region should also be considered. For example, a portion of the B2 sub-stock migrates to the Gulf of Guinea, where hydrocarbon development could be a threat to these individuals. The severity depends on oil and gas mining developments and the resultant industrial pollution along the west coast Humpback Whale breeding and migrating areas. The main effect is disturbance due to seismic exploration and shipping activities, but overall effects are currently unknown. For example, the population in Gabon increased significantly despite the oil and gas industry – so evidence suggests that they may be resilient to hydrocarbon infrastructure. Similarly, they are suspected to be less susceptible than e.g., Blue Whales to marine noise pollution. However, the resulting effects of noise pollution, mud and water discharges, alteration to the faunal composition, and accidental spillage from seismic surveys may increasingly impact critical breeding and calving habitats of this species (Cerchio et al. 2014). In particular, behavioural changes or displacement could negatively affect calf survival and reproductive success (Rosenbaum and Collins 2006). Additionally, wave and wind energy infrastructure could cause disturbance through the farms (permanent disturbance) and setting of underwater cabling (temporary disturbance). An emerging and potentially severe threat in South African and Namibian waters is allocation of rights for bulk sediment mining for benthic phosphates (Benkenstein 2014). The disturbance of sediments and extraction of minerals could potentially impact on the dynamics of nutrient cycling and productivity in yet unknown ways.
A recent decline in the abundance of krill in the Antarctic has been related to a rapid decrease in sea ice, which is linked to the effects of anthropogenic climate change (Nowacek et al. 2011), with impacts to the reproductive rate of the species (Seyboth et al. 2021). Increasing whale populations, following centuries of mismanagement and overexploitation, in association with a decline in food availability may lead to considerable inter- and intra-species competition for food in the Southern Ocean. This may result in large-scale disruptions to the feeding ecology of all Southern Hemisphere stocks which frequent Antarctic breeding grounds in summer (Nowacek et al. 2011). For further details in the impacts of climate change on the species, please check the ‘Climate Change’ section above.
Conservation
Humpback Whale populations declined dramatically during the large-scale whaling operations of the 19th and 20th centuries. In the Southern Hemisphere, Humpback Whales have been formally protected from commercial whaling since 1963. However, prior to this, whaling was spatially and temporally managed in the Antarctic. Some unwarranted Soviet whaling continued into the 1970s, but the final major catches ceased after 1968 (Reilly et al. 2008). Since then, Humpback Whale populations have shown a strong recovery.
Stringent and systematic legislation is necessary for hydrocarbon exploration and seismic surveys currently being conducted off the coast of Gabon, to ensure the conservation of threatened marine species and habitats during development and exploration projects (Rosenbaum and Collins 2006). Several marine sanctuaries in various countries protect Humpback Whales while they move through particular areas. Additionally, they are recorded in Appendix I of both CITES and CMS (Convention on the Conservation of Migratory Species of Wild Animals). Within the assessment region, no additional conservation measures have been identified for this species. However, continued research into the movements, population dynamics and threats faced by this species would assist in conservation management.
Several methods to reduce cetacean bycatch (particularly calves) in shark and fishing nets have been investigated, such as increasing the reflectivity of the net to cetacean sonar and fitting nets with warning sound alarms. These interventions have not shown major success in reducing cetacean mortalities (Dawson 1991, Jefferson and Curry 1996). However, a reduction in fishing effort, and the periodic spatial and temporal closure of fishing nets, is expected to be more effective in reducing bycatch. Within the assessment region, the KwaZulu-Natal Sharks Board has implemented methods to reduce shark net bycatch, such as limiting the length of nets, replacing nets with baited drumlines, installing nets with whale alarms, and herding animals away from nets to safer areas (Cliff and Dudley 2011). While not specifically designed as a conservation measure for Humpback Whales, they are expected to benefit from the action of lifting nets during the seasonal sardine run, when aerial surveys confirm the arrival of large shoals of sardines. These events usually coincide with the northward migration of Humpbacks along the KwaZulu-Natal coastline in June and July (Dudley and Cliff 2010).
A reduction in ship speed when traveling through high density whale areas, in order to give the whale adequate time to avoid the vessel, as well as to allow the operator time to navigate the vessel out of the whale’s path, may be an efficient means of reducing whale mortalities (Clapham 2002). This may, however, prove difficult considering the general trend of increasing ship speed for transport efficiency. Secondly, by annually monitoring whale abundance and distribution, authorities may be able to redirect current ship and ferry routes away from high density areas, in order to decrease the rate of collision (Panigada et al. 2006).
The “Blue Economy” is an innovative action plan for the sustainable use of our oceanic resources, aimed at mitigating ecological damage and ensuring that marine biodiversity is protected. By integrating Humpback Whale conservation plans into the scope of the “Blue Economy” action plans, we can ensure a holistic approach to species and habitat management, while simultaneously ensuring economic growth and development.
Recommendations for managers and practitioners:
- Systematic monitoring: design and implement a monitoring programme (acoustic and sightings) that can detect population size and trend estimates.
- Develop best practice guidelines for seismic surveys and enforce regulations.
- Develop mitigation plans for bulk sediment mining for benthic phosphates (Benkenstein 2014).
Research priorities:
- The degree of mixing within BS B and the exact location of the sub-stock B2 breeding ground, or whether the separation of sub-stocks B1 and B2 should be reconsidered.
- Broad-scale sampling of the rest of West Africa, so that the uncertainties regarding the population structure and breeding and feeding locations for the west coast sub-population can be solved. This will require broader scale genetic and photo-ID sampling and possibly satellite tagging. Without this information, it is difficult to infer how vulnerable this subpopulation might be.
- Research efficacy of strategies to reduce ship strikes.
- Potential impacts of new industrial activities, like bulk sediment mining, linked to the “Blue Economy”.
Encouraged citizen actions:
- Whale watching operators could contribute to photo-ID catalogues and behavioural observations.
- Report strandings to relevant authorities.
- Participate as volunteers in Humpback Whale research projects.
Bibliography
Allison, C. 2006. Creation of the S. Hemisphere humpback catch series. February 2006. IWC Scientific Committee, Hobart, IN, USA.
Angot, M. 1951. Rapport scientifique sur les expeditions baleinieres autour de Madagascar. Memoires de l’Institut Scientifique de Madagascar 6A: 439-486.
Acevedo, J., Capella, J., Cheeseman, T., Monnahan, C.C., Southerland, K., Acuña, P. and Aguayo-Lobo, A., 2021. First evidence of interchange of humpback whales (Megaptera novaeangliae) between the Magellan Strait and Antarctic Peninsula feeding grounds. Polar Biology, 44(3), pp.613-619.
Baker, C. S., Slade, R. W., Bannister, J. L., Abernethy, R. B., Weinrich, M. T., Lien, J., Urban, J., Corkeron, P., Calmabokidis, J., Vasquez, O. and Palumbi, S. R. 1994. Hierarchical structure of mitochondrial DNA gene flow among humpback whales Megaptera novaeangliae, world-wide. Molecular Ecology 4: 313-27.
Bannister JL, Baker A de C. 1967. Observations on food and feeding of baleen whales at Durban. Norsk Hvalfangsttid 54: 78–82.
Barendse J, Best PB, Carvalho I, Pomilla C. 2013. Mother knows best: occurrence and associations of resighted humpback whales suggest maternally derived fidelity to a Southern Hemisphere coastal feeding ground. PloS One 8.
Barendse J, Best PB, Thornton M, Elwen SH, Rosenbaum HC, Carvalho I, Pomilla C, Collins TJQ, Meÿer MA, Leeney RH. 2011. Transit station or destination? Attendance patterns, movements and abundance estimate of humpback whales off west South Africa from photographic and genotypic matching. African Journal of Marine Science 33: 353–373.
Barendse J, Best PB, Thornton M, Pomilla C, Carvalho I, Rosenbaum HC. 2010. Migration redefined? Seasonality, movements and group composition of humpback whales Megaptera novaeangliae off the west coast of South Africa. African Journal of Marine Science 32: 1–22.
Bengtson Nash, S.M., Castrillon, J., Eisenmann, P., Fry, B., Shuker, J.D., Cropp, R.A., Dawson, A., Bignert, A., Bohlin‐Nizzetto, P., Waugh, C.A. and Polkinghorne, B.J., 2018. Signals from the south; humpback whales carry messages of Antarctic sea‐ice ecosystem variability. Global Change Biology, 24(4), pp.1500-1510.
Benkenstein A. 2014. Seabed Mining: Lessons from the Namibian Experience. South African Institute of International Affairs, Policy Briefing No. 87.
Best PB, Allison C. 2010. Catch history, seasonal and temporal trends in the migrations of humpback whales along the west coast of southern Africa. Scientific Committee of the International Whaling Commission. Agadir, Morocco.
Best PB. 2011. Where is the breeding ground for humpback whales from Breeding Stock B2? IWC Scientific Committee meeting. Tromsø, Norway.
Best, P. B., Sekiguchi, K. and Findlay, K. P. 1995. A suspended migration of humpback whales Megaptera novaeangliae on the west coast of South Africa. Marine Ecology Progress Series 118: 1-12.
Blair, H.B., Merchant, N.D., Friedlaender, A.S., Wiley, D.N. and Parks, S.E., 2016. Evidence for ship noise impacts on humpback whale foraging behaviour. Biology letters, 12(8), p.20160005.
Branch, T. A. 2011. Humpback whale abundance south of 60°S from three complete circumpolar sets of surveys. J. Cetacean Res. Manage. Special Issue. 3, 53–69.
Cai, W., Borlace, S., Lengaigne, M., Van Rensch, P., Collins, M., Vecchi, G., Timmermann, A., Santoso, A., McPhaden, M.J., Wu, L. and England, M.H., 2014. Increasing frequency of extreme El Niño events due to greenhouse warming. Nature climate change, 4(2), pp.111-116.
Carvalho I, Loo J, Collins T, Barendse J, Pomilla C, Leslie MS, Ngouessono S, Best PB, Rosenbaum HC. 2014. Does temporal and spatial segregation explain the complex population structure of humpback whales on the coast of West Africa? Marine Biology 161: 805–819.
Cerchio S, Strindberg S, Collins T, Bennett C, Rosenbaum H. 2014. Seismic surveys negatively affect humpback whale singing activity off northern Angola. PloS One 9.
Chittleborough, R.G., 1965. Dynamics of two populations of the humpback whale, Megaptera novaeangliae (Borowski). Marine and Freshwater Research, 16(1), pp.33-128.
Clapham, P. J. 2002. Humpback whale Megaptera novaeangilae. In: W. F. Perrin, B. Wursig and J. G. M. Thewissen (eds), Encyclopedia of Marine Mammals, pp. 589-592. Academic Press.
Clapham, P. J. and Mead, J. G. 1999. Megaptera novaeangliae. Mammalian Species 604: 1-9.
Cliff, G. and Dudley, S.F.J. 2011. Reducing the environmental impact of shark-control programs: a case study from KwaZulu-Natal, South Africa. Marine and Freshwater Research 62: 700–709.
Cypriano‐Souza, A.L., Engel, M.H., Caballero, S., Olavarría, C., Flórez‐González, L., Capella, J., Steel, D., Sremba, A., Aguayo, A., Thiele, D. and Baker, C.S., 2017. Genetic differentiation between humpback whales (Megaptera novaeangliae) from Atlantic and Pacific breeding grounds of South America. Marine Mammal Science, 33(2), pp.457-479.
Dalla Rosa L, Secchi ER, Maia YG, Zerbini AN, Heide-Jørgensen MP. 2008. Movements of satellite-monitored humpback whales on their feeding ground along the Antarctic Peninsula. Polar Biology 31: 771–781.
Dawson SM. 1991. Modifying gillnets to reduce entanglement of cetaceans. Marine Mammal Science 7: 274–282.
Dey, S. P., Vichi, M., Fearon, G., Seyboth, E., Findlay, K. P., Meynecke, J. O., et al. 2021. Oceanographic anoMalies coinciding with humpback whale super-group occurrences in the Southern Benguela. Sci. Rep. 11, 1–13. doi: 10.1038/s41598-021-00253-2
Dudley SF, Cliff G. 2010. Influence of the annual sardine run on catches of large sharks in the protective gillnets off KwaZulu-Natal, South Africa, and the occurrence of sardine in shark diet. African Journal of Marine Science 32: 383–397.
Elwen SH, Tonachella N, Barendse J, Collins T, Best PB, Rosenbaum HC, Leeney RH, Gridley T. 2014. Humpback whales off Namibia: occurrence, seasonality, and a regional comparison of photographic catalogs and scarring. Journal of Mammalogy 95: 1064–1076.
Findlay KP, Best PB, Meÿer MA. 2011. Migrations of humpback whales past Cape Vidal, South Africa, and an estimate of the population increase rate (1988–2002). African Journal of Marine Science 33: 375–392.
Findlay KP. 1997. Attitudes and expenditures of whale watchers in Hermanus, South Africa. South African Journal of Wildlife Research 27: 57-62.
Findlay, K.P. and Best, P.B. 1996. Estimates of the numbers of humpback whales observed migrating past Cape Vidal, South Africa, 1988–1991. Marine Mammal Science 12: 354–370.
Findlay, K.P., 2001. A review of humpback whale catches by modern whaling operations in the Southern Hemisphere. Memoirs-Queensland Museum, 47(2), 411-420.
Findlay, K.P., Seakamela, S.M., Meÿer, M.A., Kirkman, S.P., Barendse, J., Cade, D.E., Hurwitz, D., Kennedy, A.S., Kotze, P.G., McCue, S.A. and Thornton, M., 2017. Humpback whale “super-groups”–A novel low-latitude feeding behaviour of Southern Hemisphere humpback whales (Megaptera novaeangliae) in the Benguela Upwelling System. PloS one, 12(3), p.e0172002.
Fleming, A., and Jackson, J. 2011. Global review of Humpback whales (Megaptera novaeangliae). NOAA Technical Memorandum NMFS SWFSC-474, La Jolla.
Gridley, T., Silva, M.F.P., Wilkinson, C., Seakamela, S.M. and Elwen, S.H., 2018. Song recorded near a super-group of humpback whales on a mid-latitude feeding ground off South Africa. The Journal of the Acoustical Society of America, 143(4), pp.EL298-EL304.
Hazevoet CJ, Gravanita B, López Suárez P, Wenzel FW. 2011. Seasonality of humpback whale Megaptera novaeangliae (Borowski, 1781) records in Cape Verde seas: evidence for the occurrence of stocks from both hemispheres. Zoologia Caboverdiana 2: 25–29.
Hill, S.L., Atkinson, A., Pakhomov, E.A. and Siegel, V., 2019. Evidence for a decline in the population density of Antarctic krill Euphausia superba still stands. A comment on Cox et al. Journal of Crustacean Biology, 39(3), pp.316-322.
Hutchings L, Jarre A, Lamont T, Van den Berg M, and Kirkman SP. 2012. St Helena Bay (southern Benguela) then and now: muted climate signals, large human impact. African Journal of Marine Science 34(4): 559-583.
IUCN (International Union for Conservation of Nature). 2012. Megaptera novaeangliae. Available at: http://www.iucnredlist.org. (Accessed: 21 February 2016).
International Whaling Commission, 1991. Report of the Scientific Committee, Annex E. Report of the Sub-Committee on Southern Hemisphere Minke Whales. Rep. int. Whal. Commn, 41, pp.113-131.
International Whaling Commission, 2007. Annual Report of the International Whaling Commission 2006. Covering the 2005-2006 financial year and the 58th Annual Meeting held in St Kitts and Nevis 2006. (Cambridge: International Whaling Commission), 203. Available at: https://archive.iwc.int/?r=61
International Whaling Commission, 2006. Annex H: report of the sub‐committee on other Southern Hemisphere Whale Stocks. Journal of Cetacean Research and Management, 8(Suppl), pp.151-170.
International Whaling Commission, 2016. Report of the Scientific Committee. J. Cetacean Res. Manag. Supplement 17, 1–92.
Jackson JA et al. 2015. Southern Hemisphere Humpback whale comprehensive assessment, a synthesis and summary: 2005-2015. International Whaling Commission document.
Jefferson TA, Curry BE. 1996. Acoustic methods of reducing or eliminating marine mammal-fishery interactions: do they work? Ocean & Coastal Management 31: 41–70.
Johnston SJ, Butterworth DS. 2009. Capture-recapture analyses of humpback whale population sizes and increase rates: breeding sub-stock B1. International Whaling Commission Scientific Committee. Santiago, Chile.
Kershaw, F. et al. Multiple processes drive genetic structure of humpback whale (Megaptera novaeangliae) populations across spatial scales. Mol. Ecol. 26, 977–994. https://doi.org/10.1111/mec.13943 (2017).
Lavery, T.J., Roudnew, B., Gill, P., Seymour, J., Seuront, L., Johnson, G., Mitchell, J.G. and Smetacek, V., 2010. Iron defecation by sperm whales stimulates carbon export in the Southern Ocean. Proceedings of the Royal Society B: Biological Sciences, 277(1699), pp.3527-3531.
Lavery, T.J., Roudnew, B., Seymour, J., Mitchell, J.G., Smetacek, V. and Nicol, S., 2014. Whales sustain fisheries: blue whales stimulate primary production in the Southern Ocean. Marine Mammal Science, 30(3), pp.888-904.
Leaper RE, Bannister JL, Branch TA, Clapham P, Donovan G, Reilly S, Zerbini AN. 2008. A review of abundance, trends and foraging parameters of baleen whales in the Southern Hemisphere. IWC Scientific Committee .
Marcondes, M.C.C., Cheeseman, T., Jackson, J.A., Friedlaender, A.S., Pallin, L., Olio, M., Wedekin, L.L., Daura-Jorge, F.G., Cardoso, J., Santos, J.D.F. and Fortes, R.C., 2021. The Southern Ocean Exchange: porous boundaries between humpback whale breeding populations in southern polar waters. Scientific Reports, 11(1), p.23618.
Mehta, A. V., Allen, J., Constantine, R., Garrigue, C., Gill, P., Jann, B., Jenner, C., Marx, M., Matkin, C., Matilla, D., Minton, G., Mizroch, S., Olavarrias, C., Robbins, J., Russell, K., Seton, R., Steiger, G., Víkingsson, V., Wade, P., Witteveen, B. and Clapham, P. J. 2007. Baleen whales are not important as prey for killer whales Orcinus orca in high-latitude regions. Marine Ecology Progress Series 348: 297–307.
Mikhalev, Y. A. 1997. Humpback whales Megaptera novaeangliae in the Arabian Sea. Marine Ecology Progress Series 149: 13-21.
Moore SE. 2008. Marine mammals as ecosystem sentinels. Journal of Mammalogy 89: 534-540.
Müller A, Butterworth DS, Johnston SJ. 2011. Assessments of the southern hemisphere humpback whale breeding stock B: Results for the models and sensitivities proposed at and following the 62nd meeting of the Scientific Committee of the IWC. International Whaling Commission: 1–45.
Nowacek DP, Friedlaender AS, Halpin PN, Hazen EL, Johnston DW, Read AJ, Espinasse B, Zhou M, Zhu Y. 2011. Super-aggregations of krill and humpback whales in Wilhelmina Bay, Antarctic Peninsula. PLoS ONE 6.
O’Connor S, Campbell R, Cortez H, Knowles T. 2009. Whale Watching Worldwide: tourism numbers, expenditures and expanding economic benefits, a special report from the International Fund for Animal Welfare. Economists at Large, Yarmouth MA, USA.
Panigada, S., Pesante, G., Zanardelli, M., Capoulade, F., Gannier, A. and Weinrich, M. 2006. Mediterranean fin whales at risk from fatal ship strikes. Marine Pollution Bulletin 52: 1287-1298.
Pomilla C, Rosenbaum HC. 2005. Against the current: an inter-oceanic whale migration event. Biology Letters 1: 476–479.
Pershing, A.J., Christensen, L.B., Record, N.R., Sherwood, G.D. and Stetson, P.B., 2010. The impact of whaling on the ocean carbon cycle: why bigger was better. PloS one, 5(8), p.e12444.
Purdon, J., Shabangu, F.W., Pienaar, M., Somers, M.J. and Findlay, K., 2020. Cetacean species richness in relation to anthropogenic impacts and areas of protection in South Africa’s mainland Exclusive Economic Zone. Ocean & Coastal Management, 197, p.105292.
Ramp, C., Delarue, J., Palsbøll, P.J., Sears, R. and Hammond, P.S., 2015. Adapting to a warmer ocean—seasonal shift of baleen whale movements over three decades. PloS one, 10(3), p.e0121374.
Rayne, GW. Whale marking: Progress and results to December 1939. Discov. Rep. 19, 245–284 (1940).
Reilly, S. B., Bannister, J. L., Best, P. B., Brown, M., Brownell Jr., R. L., Butterworth, D. S., Clapham, P. J., Cooke, J., Donovan, G. P., Urbán, J., and Zerbini, A. N. 2008. Megaptera novaeangliae. In ‘The IUCN Red List of Threatened Species’. Version 2008. Available at: www.iucnredlist.org. (Accessed: 5 January 2009).
Roman, J., Estes, J.A., Morissette, L., Smith, C., Costa, D., McCarthy, J., Nation, J.B., Nicol, S., Pershing, A. and Smetacek, V., 2014. Whales as marine ecosystem engineers. Frontiers in Ecology and the Environment, 12(7), pp.377-385.
Rosenbaum H, Collins T. 2006. The ecology, population characteristics and conservation efforts for humpback whales (Megaptera novaeangliae) on their wintering grounds in the coastal waters of Gabon. Bulletin of the Biological Society of Washington 12: 425–433.
Rosenbaum HC, Maxwell SM, Kershaw F, Mate B. 2014. Long-range movement of humpback whales and their overlap with anthropogenic activity in the South Atlantic Ocean. Conservation Biology 28: 604–615.
Rosenbaum HC, et al. 2009. Population structure of humpback whales from their breeding grounds in the South Atlantic and Indian Oceans. PLoS One 4.
Rouault, M., Pohl, B. and Penven, P., 2010. Coastal oceanic climate change and variability from 1982 to 2009 around South Africa. African Journal of Marine Science, 32(2), pp.237-246.
Rouault, M. and Tomety, F.S., 2022. Impact of El Niño–Southern oscillation on the Benguela upwelling. Journal of Physical Oceanography, 52(10), pp.2573-2587.
Schmidly, D.J. & Bradley, R.D. 2016. The Mammals of Texas, Seventh Edition. University of Texas Press, Museum of Texas Tech University.
Seyboth, E., Félix, F., Lea, M.A., Dalla Rosa, L., Watters, G.M., Reid, K. and Secchi, E.R., 2021. Influence of krill (Euphausia superba) availability on humpback whale (Megaptera novaeangliae) reproductive rate.
Shabangu, F.W. and Kowarski, K.A., 2022. The beat goes on: Humpback whale song seasonality in Antarctic and south African waters. Frontiers in Marine Science, 9, p.827324.
Shabangu, F.W., Yemane, D., Best, G. and Estabrook, B.J., 2022. Acoustic detectability of whales amidst underwater noise off the west coast of South Africa. Marine Pollution Bulletin, 184, p.114122.
Shabangu, F.W., Munoz, T., Van Uffelen, L., Estabrook, B.J., Yemane, D., Stafford, K.M., Branch, T.A., Vermeulen, E., van den Berg, M.A. and Lamont, T., 2024. Diverse baleen whale acoustic occurrence around two sub-Antarctic islands: A tale of residents and visitors. Scientific Reports, 14(1), p.21663.
Skinner, J.D. and Chimimba, C.T. (eds). 2005. The Mammals of the Southern African Subregion. Cambridge University Press, United Kingdom, Cambridge.
South African Whale Disentanglement Network (SAWDN 219-529 NPO). 2023. Chairmans Annual Report.
Stevick PT, Neves MC, Johansen F, Engel MH, Allen J, Marcondes MC, Carlson C. 2011. A quarter of a world away: female humpback whale moves 10 000 km between breeding areas. Biology Letters 7: 299–302.
Stevick, P., Allen, J., Engel, M.H., Félix, F.E.R.N.A.N.D.O., Haase, B. and Neves, M., 2014. First record of inter-oceanic movement of a humpback whale between Atlantic and Pacific breeding grounds off South America. Journal of Cetacean Research and Management, 13(2), pp.159-162.
Taylor, B.L., Chivers, S.J., Larese, J. and Perrin, W.F. 2007. Generation length and percent mature estimates for IUCN assessments of cetaceans. NOAA, Southwest Fisheries Science Center Administrative Report LJ-07-01. La Jolla, California.
Tulloch, V.J., Plagányi, É.E., Brown, C., Richardson, A.J. and Matear, R., 2019. Future recovery of baleen whales is imperiled by climate change. Global change biology, 25(4), pp.1263-1281.
Valsecchi E et al. 1997. Microsatellite genetic distances between oceanic populations of the humpback whale (Megaptera novaeangliae). Molecular Biology and Evolution 14: 355–362.
Weir, C.R. 2010. A review of cetacean occurrence in West African waters from the Gulf of Guinea to Angola. Mammal Review 40(1): 2–39.
Weir, C.R. 2011. Distribution and seasonality of cetaceans in tropical waters between Angola and the Gulf of Guinea. African Journal of Marine Science 33(1): 1-15.
Zemsky, V., Mikhalev, Yu. and Berzin, A. 1996. Supplementary information about Soviet whaling in the Southern Hemisphere. Reports of the International Whaling Commission 46: 131-135.
van Waerebeek K, Tchilbozo S, Montcho J, Nobime G, Sohou Z, Sohouhoue P, Dossou C. 2001. The Bight of Benin, a North Atlantic breeding ground of a Southern Hemisphere humpback whale population, likely related to Gabon and Angola substocks. International Whaling Commission, Cambridge, UK.
Wilkinson, C., Seyboth, E., Olbers, J., Vermeulen, E., Kramer, R. & Findlay, K. 2023. Estimating population changes in humpback whales Megaptera novaeangliaemigrating past Cape Vidal, South Africa, African Journal of Marine Science, DOI: 10.2989/1814232X.2023.2193591