

Black Rhinoceros
Diceros bicornis

2025 Red list
status
Endangered
Regional Population Trend
Stable
Change compared
to 2016
No Change
Overview
Diceros bicornis – (Linnaeus, 1758)
ANIMALIA – CHORDATA – MAMMALIA – PERISSODACTYLA – RHINOCEROTIDAE – Diceros – bicornis
Common Names: Diceros bicornis: Black Rhinoceros, Hook-lipped Rhinoceros (English), Swartrenoster (Afrikaans), !Nabas (Damara, Nama), Umkhombo, Ubhejane Onzime (Ndebele), Makgale (Sepedi), Tshukudu (Sesotho), Bodilê, Kenenyane (Setswana), Chipenbere, Hema (Shona), Sibhejane (Swati), Thema (Tshivenda), Mhelembe (Tsonga), Umkhombe (Xhosa), Ubhejane, Isibhejane (Zulu). Diceros bicornis bicornis: Southwestern Black Rhinoceros (English). Diceros bicornis minor: Southern-central Black Rhinoceros (English). Diceros bicornis michaeli: Eastern Black Rhinoceros (English). Rhinocéros noir (French), Rinoceronte Negro (Spanish; Castilian)
Synonyms: Rhinoceros bicornis Linnaeus, 1758
Taxonomic Note: The International Union for the Conservation of Nature (IUCN) recognizes three extant sub-species of black rhinoceros (hereafter black rhino) in the global red list assessment (Emslie 2020). The Western Black Rhino (Diceros bicornis longipes) is extinct (Lagrot et al. 2007). Population genetic differentiation characterizes the three extant sub-species of black rhino (Harley et al. 2005). Although outbreeding depression is unlikely, genetic differentiation warranted the sub-species status recognised by the IUCN Species Survival Commission (SSC) African Rhinoceros Specialist Group (AfRSG).
Analyses of different data sets highlight sub-species level differentiation. Whole genomes from 63 specimens dating between 1775 and 1981 identified six major historic populations (Central Africa, East Africa, North-western Africa, North-eastern Africa, Ruvuma, and Southern Africa) with four further subpopulations (Maasailand, South-western, eastern rift, and northern rift) mirroring geography, within a north–south cline (Sánchez-Barreiro et al. 2023). Although there were varying degrees of admixture among groups across the continent, several geographical barriers drove population discontinuities that resulted in high genomic diversity in the middle and decaying towards the periphery of black rhino range.
Samples from existing populations as well as museum specimens worldwide indicate that 69% of the species’ mitochondrial genetic variation has been lost (Moodley et al. 2017). Nuclear and mitochondrial DNA identified four surviving Evolutionary Significant Units (ESU’s) (Moodley et al. 2017). Three of these ESU’s (labelled SC, EA and CE haplogroups/populations) co-occur with secondary contact in the core black rhino range in East Africa. These results support the recognition of these three ESU’s as a single Management Unit that is equivalent to the Eastern Black Rhino sub-species (D. b. michaeli).
Contemporary samples within southern Africa illuminated important nuances in genetic structure – e.g., D. b. minor samples identified individuals from the Zambesi, KwaZulu-Natal (KZN) or mixed Zambesi/KZN origin (Moodley et al. 2017, Harper et al. 2018). Samples from KZN animals had less genetic diversity than ones from the Zambesi due to a recent bottleneck (Harper et al. 2018), whereas most of the genetic diversity was recovered in the large mixed KZN/Zambesi founded population in the Kruger National Park (C. Harper pers. comm. 2018). Within South Africa and Eswatini, separation of D. b. bicornis and D. b minor aligns with climatic (primarily rainfall) and habitat differences but is influenced by barriers to movement such as the “Transkei gap”.
This assessment thus recognizes three extant sub-species: Eastern Black Rhino (D. b. michaeli, extra-limital to South Africa and Eswatini), South-western Black Rhino (D. b. bicornis, extra-limital to Eswatini) and South-central Black Rhino (D. b. minor).
Red List Status: EN – Endangered
Table 1. Summary of listings for black rhinos and sub-species. * Watch-list Threat. † – Conservation dependent. ‡ Assessed in 2020 (Emslie 2020).
| Regional Red List Status (2024) | Endangered, C2a(i)*† | Global Red List Status (2020) | – |
| D. b. bicornis | Endangered D*† | D. bicornis | Critically Endangered A2abcd |
| D. b. minor | Endangered C2a(i)*† | D. b. bicornis | Vulnerable D1 |
| D. b. michaeli | Critically Endangered C2a(i)*† and D*† and E*† | D. b. minor ‡ | Critically Endangered A2abcd |
| Eswatini Red List Status (2024) | Critically Endangered C2a(i)*† and D*† and E*† | D. b. michaeli | Critically Endangered A2abcd |
| D. b. minor | Critically Endangered C2a(i)*† and D*† and E*† | TOPS listing (NEMBA) (2007) | – |
| South Africa Red List Status (2024) | Endangered, C2a(i)*† | D. bicornis | Endangered |
| D. b. bicornis | Endangered D*† | D. b. bicornis | Endangered |
| D. b. minor | Endangered C2a(i)*† | D. b. minor | Endangered |
| D. b. michaeli | Critically Endangered C2a(i)*† and D*† and E*† | D. b. michaeli | Endangered |
| Regional Red List Status (2016) | Endangered C2(a)i*† | CITES Listing (2005) | Appendix I |
| D. b. bicornis | Endangered D*† | Endemic | No |
| D. b. minor | Endangered C2(a)i*† | Percentage of global population at the end of 2023 | |
| D. b. michaeli | Critically Endangered D*† | ||
| Reason for change | No change | D. bicornis | 33.0% |
| D. b. bicornis | No change | D. b. bicornis | 18.2% |
| D. b. minor | No change | D. b. minor | 63.3% |
| D. b. michaeli | Additional categories | D. b. michaeli | 7.2% |
Assessment Information
Assessors: Ferreira, S.M.1, Balfour, D.2 & da Silva, J.3
Reviewers: Druce, D.J.4, Odendaal, K.5, Shrader, A.M.6 & Shaw, J.7
Institutions: 1South African National Parks 2IUCN/SSC African Rhino Specialist Group (AfRSG), 3South African National Biodiversity Institute, 4Welgevonden Game Reserve, South Africa, 5Manyoni Private Game Reserve, South Africa, 6University of Pretoria, South Africa, 7Save the Rhino International, United Kingdom
Acknowledgements: Range State representatives of the AfRSG provided annual population numbers and poaching records.
Previous Assessors & Reviewers: Emslie, R. & Adcock, K.
Assessment Rationale
Background
Continentally, black rhino numbers declined from an estimated 100,000 around the 1900s to less than 2,400 in the mid-1990s (Emslie & Brooks, 1999). Dedicated conservation efforts recovered black rhinos to an estimated 6,448 individuals by the end of 2023 (Ferreira et al. 2024b). Black rhinos are critically endangered at a global level (Emslie 2020).
While black rhinos in some range States declined since 1970, numbers within South Africa and Eswatini increased considerably at times (Ferreira et al. 2022). In 1930, there were an estimated 110 South-central Black Rhinos (D. b. minor) in South Africa in two populations in KwaZulu-Natal (KZN). Protection, active biological management, and translocations to expand range and numbers, resulted in 54 breeding populations of D. b. minor comprising 1,580 individuals by the end of 2015 (Emslie et al. 2016). The poaching-surge since 2007, reached a peak in 2015, reducing the number of South Africa’s D. b. minor herd to 1,522 individuals by the end of 2023 (Ferreira et al. 2024b). The sub-species was re-introduced into Eswatini in 1987 and has steadily increased to 55 individuals by the end of 2023 (Ferreira et al. 2024b) distributed in two populations (Ferreira et al. 2022).
In 1985 the more arid-adapted South-western Black Rhino (D. b. bicornis) was reintroduced into South Africa from Namibia, and by the end of 2015, there were nine breeding populations of this sub-species conserving an estimated 254 rhinos (Emslie et al. 2016). The sub-species did not experience the poaching impacts of D. b. minor and D. b. bicornis increased to 470 individuals by the end of 2023 (Ferreira et al. 2024b).
A single out of range Eastern Black Rhino (D. b. michaeli) population was established in Addo Elephant National Park in South Africa in 1962. This population was subsequently relocated to a private reserve in the country, and, by May 2016, numbers had grown to 93 (Emslie et al. 2016). The sub-species reached a peak of 115 in 2021 (Ferreira et al. 2022), but translocations into its natural range resulted in 100 D. b. michaeli individuals remaining by the end of 2023 (Ferreira et al. 2024b).
Regional Assessment
D. bicornis: Regionally within South Africa and Eswatini combined, D. bicornis recorded no population reduction over the past three generations (see Population Section for estimation method) (Criterion A). Since 1971, D. bicornis numbers increased at an annual exponential rate of 3.5% (95% CI: 3.3%-3.5%). When accounting for poaching impact, the underlying growth since 2005 was 5.6% (95% CI: 3.4%-7.7%). Concerning the geographic range of D. bicornis (Criterion B), the extent of occurrence was potentially spanning ~1.1 million km2 although the area of occupancy was substantially less at 36,427 km2 at the end of 2021 (AfRSG, Unpublished data) with black rhinos living at 77 localities. There were no extreme fluctuations in the extent of occurrence, area of occupancy, number of locations or number of mature individuals in the past two decades. The number of mature individuals was 840 (95% CI: 761-931) at the end of 2023. Under Criterion D this would qualify D. bicornis as Vulnerable. Under Criterion E, none of the predictions of future population sizes recorded more than 10% of the bootstrap iterations that had the number of mature individuals less than the effective population sizes of 50. Under Criterion C, the projected trend was a 1.0% (-0.4% to 2.1%) increase annually. Anticipating the worst-case, the projected trend would be a 4% decline in the next decade. Even so, the median projected trend did not predict a decline that would exceed 10% in three generations irrespective of the method of generation length estimation. In addition, the average number of mature individuals per population was 24, while the largest population had 17.4% of all the mature individuals in the region (AfRSG Unpublished data). Over time there were no extreme fluctuations in the number of mature individuals. Under Criterion C, D. bicornis is endangered because there are <2,500 mature individuals, and a predicted decline under the worst-case scenario, and the average number of mature individuals per population was <250, categorizing D. bicornis as Endangered – criteria evaluation C2a(i).
D. b. bicornis: There has been an increase in regional population size over three generations, irrespective of the method used to determine generation time, from both breeding and introductions of additional founder rhinos from Namibia. As a result, observed numbers changed exponentially at 11.5% (95% CI: 11.0%-12.0%) per annum since reintroduction in 1985. In the past generation since 2005, D. b. bicornis numbers increased at an exponential rate of 8.3% (7.7%-8.8%) per annum. The sub-species extent of occurrence was ~670,000 km2 of which it occupied 4,596 km2 at 8 localities at the end of 2021 (AfRSG Unpublished data). It had 186 (95% CI: 179-194) mature individuals with a predicted future trend of 2.8% (1.8%-3.8%) increase per annum in the next decade. The worst-case scenario still predicts an annual increase. No predictions recorded more than 10% of iterations that had the number of mature individuals less than the effective population sizes of 50. The average mature individuals per population was 20 with the largest population holding 57.5% of all mature individuals with no large fluctuations. As there are fewer than 250 mature individuals in the region, D. b. bicornis is rated as Endangered – criteria evaluation D.
D. b. minor: There has been an increase in the number of individuals over the past three generations, irrespective of the method used to determine generation length. Since 1971 numbers increased by 3.0% (95% CI: 2.8%-3.2%) per annum. In recent years, however, D. b. minor experienced high poaching impact. In the past generation since 2005, the numbers of D. b. minor declined at -0.1% (-0.5% to 0.3%) per annum. Accounting for poaching pressure, the population growth was 4.2% (1.7%-6.8%) per annum. The sub-species extent of occurrence was ~420,000 km2 of which it occupied 31,481 km2 at a minimum of 68 localities at the end of 2021 (AfRSG Unpublished data). It had 614 (95% CI: 535-702) mature individuals. The population will most likely decline in the next decade (-0.1%, -2.5% to 1.4%) with the worst-case predicting a substantial annual population decline. No predictions recorded more than 10% of iterations that had the number of mature individuals less than the effective population sizes of 50. The average number of mature individuals per population was 24 with the largest population holding 27.9% of all individuals. Under Criterion C, D. b. minor is endangered because there are <2,500 mature individuals, and a predicted decline under the worst-case scenario. The average number of mature individuals per population was <250, categorizing D. b. minor as Endangered – criteria evaluation C2a(i).
D. b. michaeli: Numbers of this out-of-range sub-species have increased over the past three generations at 5.0% (95% CI: 4.8%-5.2%) per annum. In the last generation since 2005, D. b. michaeli increased annually at 4.7% (3.9% – 5.5%). The sub-species has not experienced poaching pressures. Even so, D. b. michaeli numbers are likely to decline in the next decade (-0.4%, -1.1% to 0.0%) because of the restricted area available as well as translocation to destinations elsewhere in Africa. The species is out-of-range with the worst-case an annual decline. The sub-species’ extent of occurrence (350 km2) as well as area of occupancy (350 km2) is relatively low linked to the out-of-range status with only one locality. The population had an estimated 40 (95% CI: 39-40) mature individuals categorizing D. b. michaeli as Critically Endangered under criterion D, while in 80% of the iterations of predictions in three generations, there were less than 50 mature individuals categorizing D. b. michaeli as Critically Endangered under criterion E. Future translocations into the D. b. michaeli natural range are likely to reduce their numbers in the region further. Furthermore, under criterion C, D. b. michaeli is Critically Endangered (criteria evaluation C2a(i)) because there are <250 mature individuals, and a predicted decline under the worst-case scenario. The average number of mature individuals per population was <50.
South African Assessment
Diceros bicornis: At the species level, D. bicornis numbers increased over the past three generations with observed growth per annum since 1971 at 3.4% (5% CI: 3.3-3.6%). Poaching pressures, particularly within Kruger National Park, resulted in annual growth of 1.1% (0.8%-1.4%) in the last generation within South Africa. Declines were prominent in Kruger National Park since 2015 (Ferreira et al. 2018). Poaching has abated since 2020 (Ferreira et al. 2024c). When accounting for the poaching impact, D. bicornis numbers had annual underlying growth of 5.5% (3.3%-7.7%). Even so, forecasted growth in the next decade is 0.7% (-1.1% to 1.6%) per annum. The worst-case forecasts a decline in numbers. The species’ extent of occurrence was potentially spanning ~1.1 million km2 although the area of occupancy was 36,225 km2 at the end of 2021 (AfRSG, Unpublished data) with black rhinos living at 75 localities. There were an estimated 818 (95% CI: 739-909) mature individuals with on average 25 mature animals per population, and the largest population holding 18.0% of all mature individuals. Under criterion E, no predictions recorded more than 10% of iterations that had the number of mature individuals less than the effective population sizes of 50. Under criterion C, D. bicornis is Endangered because there are <2,500 mature individuals, and a predicted decline under the worst-case scenario. The average number of mature individuals per population was <250, categorizing D. bicornis as Endangered – criteria evaluation C2a(i).
D. b. bicornis: In the region, the sub-species is only present in South Africa and thus qualifies as Endangered – criteria evaluation D.
D. b. minor: The sub-species increased in the past three generations in South Africa at 2.9% (95% CI: 2.7%-3.1%) per annum. In the last generation, however, the sub-species has borne the brunt of the poaching, with Kruger National Park’s D. b. minor population being especially impacted (Ferreira et al. 2018). This resulted in the number of D. b. minor fluctuating with an annual decline of -0.3% (-0.4% to 0.1%) in the past generation. When accounting for the poaching impact, the annual underlying growth in the past decade was 4.1% (1.5%-6.7%). The forecasted growth in the next decade is likely to be -0.2% (-2.9% to 1.2%) per annum, a predicted average decline. Extent of occurrence was ~400,000 km2 with area of occupancy at least 31,279 km2 within 66 populations (AfRSG Unpublished data). There were an estimated 592 (95% CI: 510-674) mature individuals, with an average of 27 mature individuals per population, and 29.3% of mature individuals in the largest population. No predictions recorded more than 10% of iterations that had the number of mature individuals less than the effective population sizes of 50. Under criterion C, D. b. minor is Endangered (C2a(i)) because there are <2,500 mature individuals, and a predicted decline. The average number of mature individuals per population was <250.
D. b. michaeli: In the region the sub-species is only present in South Africa and thus qualifies as Critically Endangered – criteria evaluation C2a(i), D and E.
Eswatini Assessment
D. bicornis: The species in Eswatini increased in the past three generations at 6.0% (95% CI: 5.4%-6.6%). The underlying growth in the last generation since 2005 was 7.2% (1.4%-13.0%) with relatively low poaching impact. In one generation in future, predictions suggest an increase of 8% (-4.0% to 7.7%) per annum. At worst there will be a future decline. The species has an area of extent of 17,364 km2 but occupies only 202 km2 (AfRSG, Unpublished data) in 2 populations. There were 22 (95% CI: 21-23) mature individuals classifying D. bicornis as Critically Endangered under criterion D. The average number of mature individuals per population was 10, and 56.3% of mature individuals in the largest population. In 58% of the iterations of predictions in three generations for a generation length of 14 years, there were less than 50 mature individuals categorizing D. bicornis as Critically Endangered under criterion E. Furthermore, under criterion C, D. bicornis is Critically Endangered (C2a(i)) because there are <250 mature individuals, and a predicted decline under the worst-case scenario. The average number of mature individuals per population was <50.
D. b. minor: The sub-species is the only species present in Eswatini and thus qualifies as Critically Endangered – criteria evaluation C2a(i), D and E.
Regional Population Effects
All three black rhino sub-species occur in other range states outside of South Africa and Eswatini, and translocation techniques are well developed. If the South African and Eswatini indigenous sub-species were to degrade as predicted due to poaching, rhino could potentially be brought back to this region. This would be conditional on the generosity of other range states and the continued survival of these sub-species in these countries. The likelihood that poaching in other range states may take place given the trends in the past generation, could result in reduced numbers elsewhere that could provide founder animals to rescue the sub-species in this region. Therefore, it is unlikely for rescue from outside the region to occur in the short to medium term.
Reasons for Change
Reason(s) for Change in Red List Category from the Previous Assessment:
There were no changes in the status for D. b. michaeli in the region, or South Africa, and for D. b. minor in Eswatini. These, however, had additional categories with the status confirmed across three different categories.
Red List Index
Red List Index: Endangered C2a(i)
Recommended citation: Ferreira SM, Balfour D & da Silva JM. 2025. A conservation assessment of Diceros bicornis. In Patel T, Smith C, Roxburgh L, da Silva JM & Raimondo D, editors. The Red List of Mammals of South Africa, Eswatini and Lesotho. South African National Biodiversity Institute and Endangered Wildlife Trust, South Africa.
Regional Distribution and occurrence
Geographic Range
There are three remaining recognised sub-species of D. bicornis occupying East and southern African countries (see Taxonomic Note). The Western Black Rhino, D. b. longipes once ranged through the savannah zones of central West Africa but is now extinct (Lagrot et al. 2007). Within the assessment region, D. bicornis is not recorded as having occurred in Lesotho. There is also an area south of Lesotho and south of the southern boundary of KwaZulu-Natal (KZN) into Eastern Cape which is not considered part of the species range i.e., the Transkei Gap (DFFE 2024).
There was no Southwestern Black Rhino (D. b. bicornis) in South Africa in 1973 with the sub-species first being reintroduced in 1985. The sub-species is not native to Eswatini. The area of occupancy in South Africa is estimated at 4,596 km2 in western and south-eastern South Africa by the end of 2021 (AfRSG Unpublished data).
Southern-central Black Rhino (D. b. minor) occurred from southern Tanzania through Zambia, Zimbabwe, and Mozambique to the northern, north-western and north-eastern parts of South Africa (north of the Mtamvuna River). It most likely occurred in southern Democratic Republic of the Congo, eastern Botswana, Malawi, and Eswatini. By 2023, its stronghold was South Africa and, to a lesser extent Zimbabwe, with reintroductions into Zambia and Malawi, and a small remnant population remaining in southern Tanzania (Ferreira et al. 2024b). The sub-species went locally extinct in Angola and Mozambique, but by 2023, several D. b. minor individuals moved into Mozambique from South Africa. The sub-species has been reintroduced to localities in Botswana, Malawi, Mozambique, Eswatini and Zambia.
Although previously widely distributed within the assessment region, the sub-species D. b. minor now only exists in a few isolated pockets within its former range. The majority of these are on formal conservation areas although some are on private lands. Specifically, it occurs within the eastern Lowveld in Limpopo and Mpumalanga and KZN Lowveld habitats in South Africa. In the Limpopo Province, its range extends westwards to the North West Province. The putative distribution of D. b. minor is partially predicted by rainfall isohyets, but also the potential barrier to movement south of KZN posed by the “Transkei gap”. Eswatini falls within D. b. minor range. By the end of 2021, there were 68 breeding locations within the region and the estimated area of occupancy was 31,481 km2 (AfRSG Unpublished data).
The Eastern Black Rhino (D. b. michaeli) was introduced to South Africa in 1962 and now exists on private land. The sub-species is out-of-range and occupancy in South Africa was estimated at 350 km2.
Historically, a small number of subpopulations of D. b. minor were established in what was before 2007 considered D. b. minor range in the Eastern Cape. This range has now been reclassified as D. b. bicornis range. One of these populations acts as a significant donor population for various rhino range expansion initiatives. It has limited risks of mixing with D. b. bicornis and remains a valuable site (Knight et al. 2011).
Elevation / Depth / Depth Zones
Elevation Lower Limit (in metres above sea level): 0 m.
Elevation Upper Limit (in metres above sea level): Not specified.
Depth Lower Limit (in metres below sea level): Not applicable.
Depth Upper Limit (in metres below sea level): Not applicable.
Depth Zone: Not applicable.
Map
No Map
For security reasons detailed maps of the distribution of black rhino in the region are not provided. Generally, D. b. bicornis frequented the western parts of the region and D. b. minor the eastern parts (Figure 1) (DFFE 2024).
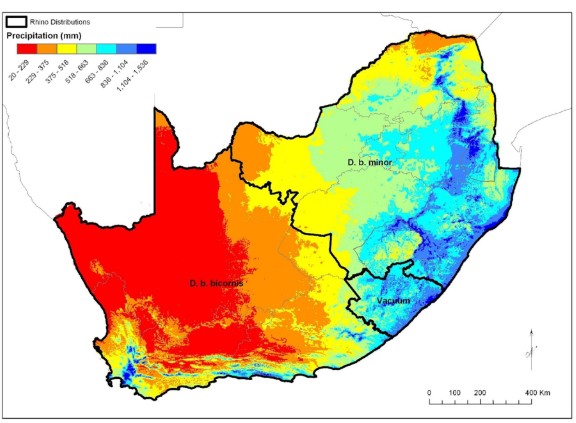
Figure 1. Broadscale geographic distribution of black rhino sub-species in the region. The line separating the two sub-species ranges for management purposes. This is overlain by the national rainfall pattern. The area south of Lesotho labelled “Vacuum” is known as an area where black rhinos were historically absent (the “Transkei Gap”). Note that black rhinos never occurred in Lesotho. Map extracted from DFFE (2024).
Biogeographic Realms
Biogeographic Realm: Afrotropical
Occurrence
Countries of Occurrence
| Country | Presence | Origin | Formerly Bred | Seasonality |
| Angola | Extinct | Native | – | Resident |
| Botswana | Extant | Reintroduced | – | Resident |
| Cameroon | Extinct | Native | – | Resident |
| Chad |
Extinct Ecological Equivalent |
Native Introduced |
– | Resident |
| Eswatini | Extant | Reintroduced | – | Resident |
| Ethiopia | Extinct | Native | – | Resident |
| Kenya | Extant | Native | – | Resident |
| Malawi | Extant | Reintroduced | – | Resident |
| Mozambique | Extant | Native | – | Resident |
| Namibia | Extant | Native | – | Resident |
| Rwanda | Extant | Reintroduced | – | Resident |
| South Africa | Extant | Native | – | Resident |
| Tanzania, United Republic of | Extant | Native | – | Resident |
| Zambia | Extant | Reintroduced | – | Resident |
| Zimbabwe | Extant | Native | – | Resident |
Large Marine Ecosystems (LME) Occurrence
Large Marine Ecosystems: Not applicable.
FAO Area Occurrence
FAO Marine Areas: Not applicable.
Climate change
Black rhinos occur across an environmental gradient that ranges from mesic to arid. Recent climate change models predict increasing temperatures (Hulme et al. 2001), and overall changes in rainfall patterns (Hulme et al. 2001, Dore 2005, Ayanlade et al. 2018). Moreover, it has been suggested that increasing CO2 may favour the growth and increased distribution of woody species. If this is the case, this may then increase food availability for black rhinos. However, changes in rainfall patterns could also increase the frequency and duration of droughts (Ayanlade et al. 2018) that may negatively impact plant growth and survival, habitat availability, and ultimately local black rhino populations.
The influence of climate change on the ranges of most species (Beyer & Manica 2020) predicts 36.0% (35.0% to 37.2%) of the range of black rhinos lost due to climate change by 2122 (Ferreira et al. 2024d). These losses will constrain available habitat to potentially accommodate 3,628 (3,206 to 4,109) D. b. bicornis, 7,257 (6,413 to 8,218) D. b. minor and 7,257 (6,413 to 8,218) D. b. michaeli in future. Potential exists for a further 3,628 (3,206 to 4,109) black rhinos of any sub-species (or blend of sub-species) could live within the range of the now extinct D. b. longipes (Ferreira et al. 2024d).
Population information
Historically the black rhino was once the most numerous of the world’s rhino species. An estimated 112,950 (99,492 to 127,898) black rhinos lived in Africa in the 1880s (Ferreira et al. 2024d), a time when the activities of settlers still had negligible impact on the transformation of habitats (Steffen 2003). There were most likely more rhinos in the previous century since rhinos, including the use of meat and horns, form part of several cultural histories (e.g., Boeyens & van der Ryst 2014), and hunting formed an important part of pre-colonial economies (MacKenzie 2017). Relentless colonial hunting of the species (e.g., Steinhart 1989) and clearances of land for settlement and agriculture reduced numbers. By 1970, an estimated 65,384 black rhinos (D. bicornis), comprising of 565 South-western Black Rhinos (D. b. bicornis), 15,311 South-central Black Rhinos (D. b. minor), 46,137 Eastern Black Rhinos (D. b. michaeli) and 3,371 Western Black Rhinos (D. b. longipes) lived in Africa (Ferreira et al. 2024d) (Figure 2).
Between 1960 and 1995, large-scale poaching caused a dramatic 98% collapse in black rhino numbers to an estimated low of 2,410 in 1995 (Emslie & Brooks 1999). Since then, innovative conservation programmes including monitoring, biological management and law enforcement helped to increase black rhino numbers at a continental scale to 5,250 by the end of 2015 (Emslie et al. 2016). By the end of 2023, Africa had 6,448 black rhinos, slightly less than 6,487 in 2022. There were 33 South-central Black Rhinos and 317 Eastern Black Rhinos in zoos across the world, while China reported 14 black rhinos of unknown origin (Ferreira et al. 2024b). South Africa and Namibia recorded 630 and 300 black rhinos in 1980 (Emslie & Brooks 1999) which increased to 1,893 and 1,946 respectively by the end of 2015 (Emslie et al. 2016). Note that South Africa, Namibia, Zimbabwe and Kenya held (92%) of wild black rhinos by the end of 2023 (Ferreira et al. 2024b).
There were an estimated 470 South-western Black Rhino (D. b. bicornis) in South Africa at the end of 2023 (Ferreira et al. 2024b). There was no South-western Black Rhino in South Africa in 1970 with the sub-species reintroduced in 1985 (Emslie & Brooks 1999). By the end of 2023 the South-central Black Rhino (D. b. minor) was estimated at 1,522 individuals in South Africa. Eastern Black Rhino (D. b. michaeli) is out-of-range in South Africa with 100 individuals, while Eswatini had 55 individuals of South-central Black Rhinos (D. b. minor) at the end of 2023 (Ferreira et al. 2024b). An important point to note is that since poaching surged from 2007 onwards (Ferreira et al. 2022) (Figure 2), detectable effects started being seen and from 2010 onwards estimates in the region fluctuated – in 2010 there were an estimated 1,941 black rhinos in the region. The trends in D. b. minor in Kruger National Park dictated the trends for the region – 2008 recorded 627 (95% CI: 588–666) (Ferreira et al. 2011) individuals that declined to 205 (95% CI: 149–261) by the end of 2022 (Ferreira et al. 2024c).
The continuing threat of poaching for, and trafficking of, rhino horns may result in reduced rhino numbers and populations. Across Africa poaching rates peaked at 5.3% of the population in 2015 (Ferreira et al. 2022). Since then, poaching rates have declined and was the lowest in 2020 at 2.3% when COVID19 restrictions were the most severe. Note that from 2020 to 2023, poaching rates on the continent varied between 2.3% and 2.5% (Ferreira et al. 2024b), less than the poaching threshold of 3.5% above which populations will decline (Ferreira et al. 2022).
Since 2020, South Africa experienced most of the losses to poaching each year – 76.8% to 85.2% of the detected incidences in any particular year (Ferreira et al. 2024b). The last detected incidence of poaching in Eswatini was in 2014. As a result, rhinos in South Africa had the highest poaching impact with 5.9% of the national population killed in 2014. This declined to 2.6% in 2020 and varied since then up to 3.1% per annum. These indices of poaching impact, however, reflect detected carcasses. Imperfect carcass detection (see Ferreira & Dziba 2023) as well as the deaths of calves that are dependent on poached cows (Nhleko et al. 2022) increase the impact of poaching on population persistence. Although poaching declined from previous highs, the recent trends suggest poaching pressure will at least remain what it has been since 2020 (see also Eikelboom & Prins 2024).
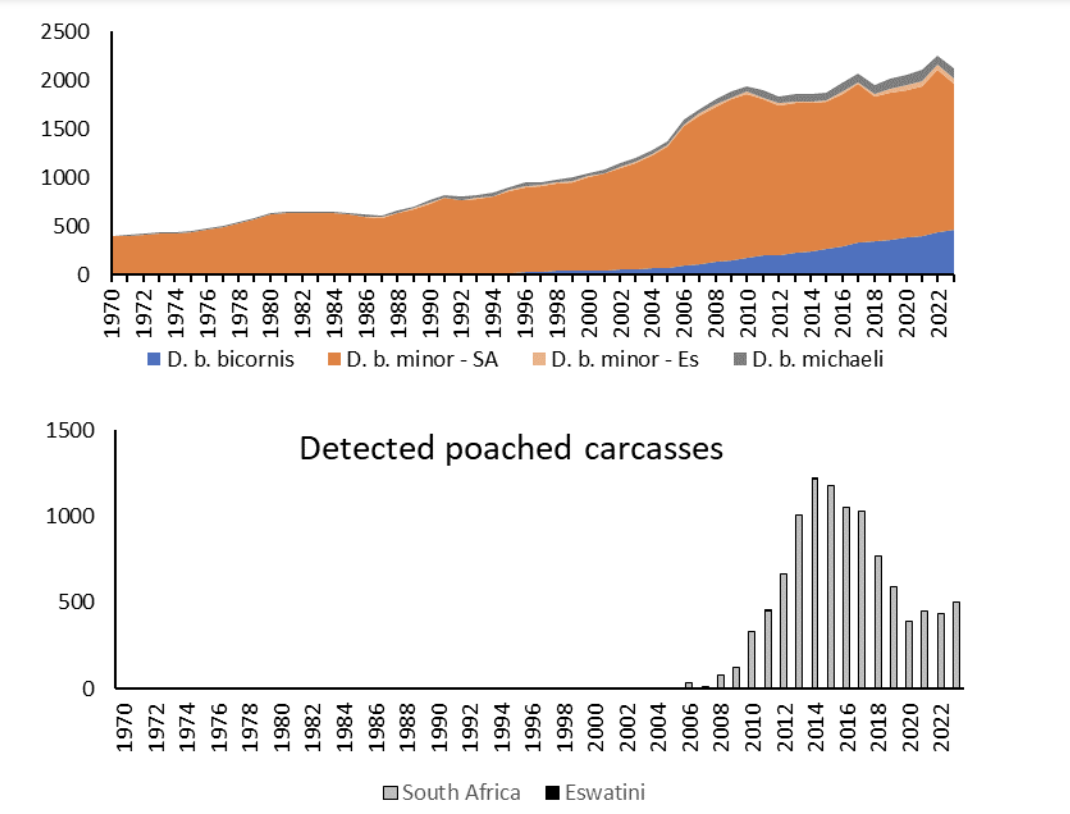
Figure 2. Numbers of Diceros bicornis individuals in the region since 1970 (Top graph) as well as detected poached rhinos since 2006 (Bottom graph). Note that the poaching data include Southern White Rhinos (Ceratotherium simum simum) in South Africa. SA – South Africa, Es – Eswatini.
This assessment made use of the IUCN Red List Categories and Criteria (Version 16) but added the regional criterion (IUCN Standards and Petitions Subcommittee 2024). IUCN uses five criteria (A-E) to evaluate if a taxon belongs in a threatened category inclusive of Critically Endangered, Endangered or Vulnerable. The criteria focus on A – Population Size Reduction; B – Geographic Range; C – Small Population Size and Decline; D – Very Small or Restricted Population; and E – Quantitative analysis. These various criteria require four aspects – estimates of generation length, estimates of the number of mature individuals, estimates of past trends and predicting future trends.
The African Rhino Specialist Group (AfRSG) collates annual black rhino population estimates for African rhino range States. In addition, in South Africa there is annual status reporting to the Southern African Development Community Rhino Management Group (SADC RMG). The AfRSG has a time series of population estimates since 1970 which provide the basis of the assessment.
Estimating generation length: Population trends within several generations is a key indicator of conservation status (IUCN Standards and Petitions Subcommittee 2024). This assessment used three methods for estimating generation length. First, the Global Red List assessment for D. b. minor defined generation length as 14.96 years (approximated to 14 years) based on the average age of parents of the current cohort (i.e., new-born individuals in the population) (Emslie 2020). Second, for an estimate of generation length for D. bicornis at the species level, the assessment made use of an age-specific Leslie matrix (Hansen 1989) to predict a stable age and sex distribution for fecundity (♂ territorial age – 10 years; ♀ age at having first birth – 6.75 years; ♀ age at having last birth – 35; birth interval – 2.5 years; and proportion of female calves at birth – o.5, Skinner & Chimimba 2005) and survival schedules (♂ age classes: A & B – 0.99, C – 0.94, D – 0.94, E – 0.64, F – 0.99; ♀ age classes: A & B – 0.99, C – 0.99, D – 0.99, E – 0.82, F – 0.99; Ferreira et al. 2011; Age classes follow Emslie et al. 1995) under optimal conditions. The average age of female parents of a new-born cohort was 16.38 years, that of male parents 18.75 years, resulting in an estimate generation length of 17.07 years (approximated to 17 years).
A third method followed the rhino status report (Ferreira et al. 2022) and the approach evaluating the conservation impacts on black rhino (Ferreira et al. 2024d). In this case, generation length is the time it takes for the population to grow by a factor of its net reproductive rate.
![]()
, where R0 is the number of female-calves a cow is expected to produce in a lifetime (Charlesworth 1994). The age at first (6.75 years) and last births (35 years) predicted 28.25 year producing calves every 2.5 years, half of which are females. The population growth (r) was 8% when there are no resource limitations (Ferreira et al. 2011; Ferreira & Greaver 2016). This predicted a generation length of 9.4 years (approximated to 10 years).
Estimating the number of mature individuals: Trends in the number of mature individuals is another key indicator of conservation status (IUCN Standards and Petitions Subcommittee 2024). For this, the assessment used a Leslie Matrix (Hansen 1989) with the same input variables of rhinos under optimal conditions (see estimation of generation length). Once the predicted age and sex distributions stabilized, the assessment checked the number of females that are older than 7 years (♀ age at having first birth – 6.75 years, Skinner & Chimimba 2005) and males that are older than 10 years (♂ territorial at 10 years of age, Skinner & Chimimba 2005). Combined, these were the number of mature individuals as a fraction of the total number of individuals in a population. This approach produced proportions lower than those previously used (Emslie 2020) and thus introduce a more conservative consideration for compliance to the red listing criteria.
Estimating past trends: The assessment focused on estimating the underlying population growth in the generation preceding the end of 2023 making use of the longest of the estimated generation lengths, i.e., 17 years. The underlying growth of a population is that which realizes from natural births and deaths as well as how rhinos disperse in and out of populations. Populations in this instance are the national combined herd of South Africa, that of Eswatini and these combined to reflect the region. Rhino dispersal at the country or regional scale is an assisted process where authorities translocate rhinos across international borders (e.g., Ferreira et al. 2022). The assessment anticipates that rhino conservation initiatives in the generation time preceding 2023 will continue at similar intensities in future (see Ferreira et al. 2024d).
Illegal offtakes remove individuals resulting in the observed population growth i.e., the changes observed from year to year. In addition, the detection of carcasses is imperfect – in any particular year, the chance that a carcass will persist (cp) is 89.8 % (95 % CI: 76.9 % − 100.0 %) of which rangers detect 89.7 % (95 % CI: 88.3 % − 91.1 %) (cd) (Ferreira & Dziba 2023). Illegal offtakes, thus, need to be corrected (increased) by a factor of 1.242 (1/(cpcd)) for South Africa. Because the population is small in Eswatini and monitoring is over small areas, no correction for imperfect detection is needed.
An additional constraint is that South Africa and Eswatini report rhino carcasses irrespective of species. The assessment thus calculated the proportion of all rhinos in a country poached in each year: ![]()
In Kruger National Park using detected poached carcasses, Southern White Rhinos (Ceratotherium simum simum) had on average 7.8% (ranging from 5.6% to 11.8%) of the population poached per annum from 2014 to 2020, with South-central Black Rhinos experiencing 7.6% (ranging from 2.3% to 15.7%) per annum in the same period (Ferreira et al. 2021). This assessment thus assumed that the proportion of all rhinos in a country poached in each year was also the likely poaching impact for D. b. minor in South Africa and Eswatini. There were negligible D. b. bicornis or D. b. michaeli poaching incidences.
Even so, a general model defined by: 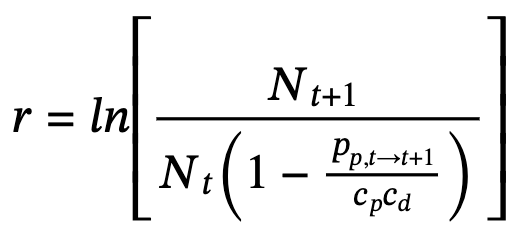 where Nt is the number of rhinos in a country or region in year t, provided an estimate of the underlying population growth in the past generation.
Predicting future trends: Predicting the future for black rhino carries uncertainty, which can influence the outcome of an assessment (IUCN Standards and Petitions Subcommittee 2024). Uncertainty originates from several sources including errors in population estimates. Fortunately, most localities use individual identification or registration techniques and have high field ranger densities. Individual observations and carcass detection rates are likely to be high.
In the region, except for estimates for Kruger National Park, most individual population estimates make use of registration studies that provide a number known to be alive at the end of any year (see Ferreira et al. 2017). For D. b. bicornis and D. b. michaeli in the region, and D. b. minor in Eswatini, the assessment set the coefficient of variance (CV) for the estimates at 2%. Although all of these make use of registration studies, rangers may not have seen some individuals for a few months at the end of the year introducing some uncertainty.
A key source of uncertainty is linked to the largest subpopulation i.e., in Kruger National Park. The estimated CV for the estimate of D. b. minor for Kruger National Park in 2022 was 23.5% (Ferreira et al. 2024c). Like before, the assessment set the uncertainty for registration estimates to a CV of 2% i.e., the 1,456 south-central black rhinos elsewhere than at Kruger National Park at the end of 2022. Therefore, for D. b. minor, the weighted average CV was 7.5% for South Africa as a whole and the expected uncertainty in the population estimates for D. b. minor in 2023.
To model future trends, the assessment assumed that the underlying population growth in the past generation is likely to continue in future. The assessment, however, takes cognizance of three environmental change drivers – illegal offtake, habitat alteration, and climate change (see Ferreira et al. 2024d). Illegal offtake will reduce the rate at which populations can change, whereas habitat alteration and climate change will influence the available habitat and quality of habitat in future. The assessment thus considers the impact of likely illegal offtake on the rate that rhinos would change towards the future rhino potential numbers.
Predicted habitat alteration and climate change forecasted rhino potential in 2122 of 3,616 (3,521 to 3,709) D. b. bicornis, 7,228 (7,039 to 7,411) D. b. minor and 7,224 (7,037 to 7,401) D. b. michaeli, based on the relative contribution of the range of each sub-species to the overall range of black rhinos (Ferreira et al. 2024d). Forecasts made use of a ricker model ![]() , where Nt is the population size at time t, r is the underlying growth rate in the past generation, p is the average poaching rate since 2020 corrected for carcass persistence and detection (see above) and K is the expected potential number of individuals in the country or region by 2122. The approach randomly drew population estimates for a sub-species or species from a normal distribution defined by the population estimate and relevant CV in 2023. It then used the Ricker model to forecast 100 years into the future using random values drawn from the normal distributions defined by r and its standard deviation, p and its standard deviation as well as K and its standard deviation. A total of 2500 iterations allowed extraction of the median, 2.5% and 97.5% percentiles to obtain predicted population estimates and its confidence interval until 2224. For each year and iteration forecasted, we converted an estimate to the number of mature individuals using the estimated proportion of mature individuals.
, where Nt is the population size at time t, r is the underlying growth rate in the past generation, p is the average poaching rate since 2020 corrected for carcass persistence and detection (see above) and K is the expected potential number of individuals in the country or region by 2122. The approach randomly drew population estimates for a sub-species or species from a normal distribution defined by the population estimate and relevant CV in 2023. It then used the Ricker model to forecast 100 years into the future using random values drawn from the normal distributions defined by r and its standard deviation, p and its standard deviation as well as K and its standard deviation. A total of 2500 iterations allowed extraction of the median, 2.5% and 97.5% percentiles to obtain predicted population estimates and its confidence interval until 2224. For each year and iteration forecasted, we converted an estimate to the number of mature individuals using the estimated proportion of mature individuals.
Extinction risk: The assessment used an indicator to assess extinction risk in future. For this purpose, the assessment defined an effective population size larger than 50 mature individuals (see Clarke et al. 2024). Extinction risk was then the percentage of iterations that had less than 50 mature individuals forecasted in 3 and 5 generations as well as 100 years in the future.
The procedure of forecasts allowed the evaluation of several thresholds as part of applying the IUCN Red List criteria (IUCN Standards and Petitions Subcommittee 2024). Note that the population forecasts assumed the key threat, illegal harvesting, will remain at high levels (e.g., Eikeboom & Prins 2024) although these stabilized (Ferreira et al. 2024b) after poaching peaked in 2015 (Ferreira et al. 2022). The history of fluctuations in poaching and rapid increases over the short- to medium term raise concerns that poaching could surge again and increase population declines in 5-20 years that could likely change the conservation status. This categorizes illegal harvesting into a watch-list threat to D. bicornis. The species and sub-species require continual conservation intervention to prevent it becoming more threatened (see Ferreira et al. 2024b) and is thus conservation dependent (Redford et al. 2011).
Regional Populations
Black Rhino Diceros bicornis
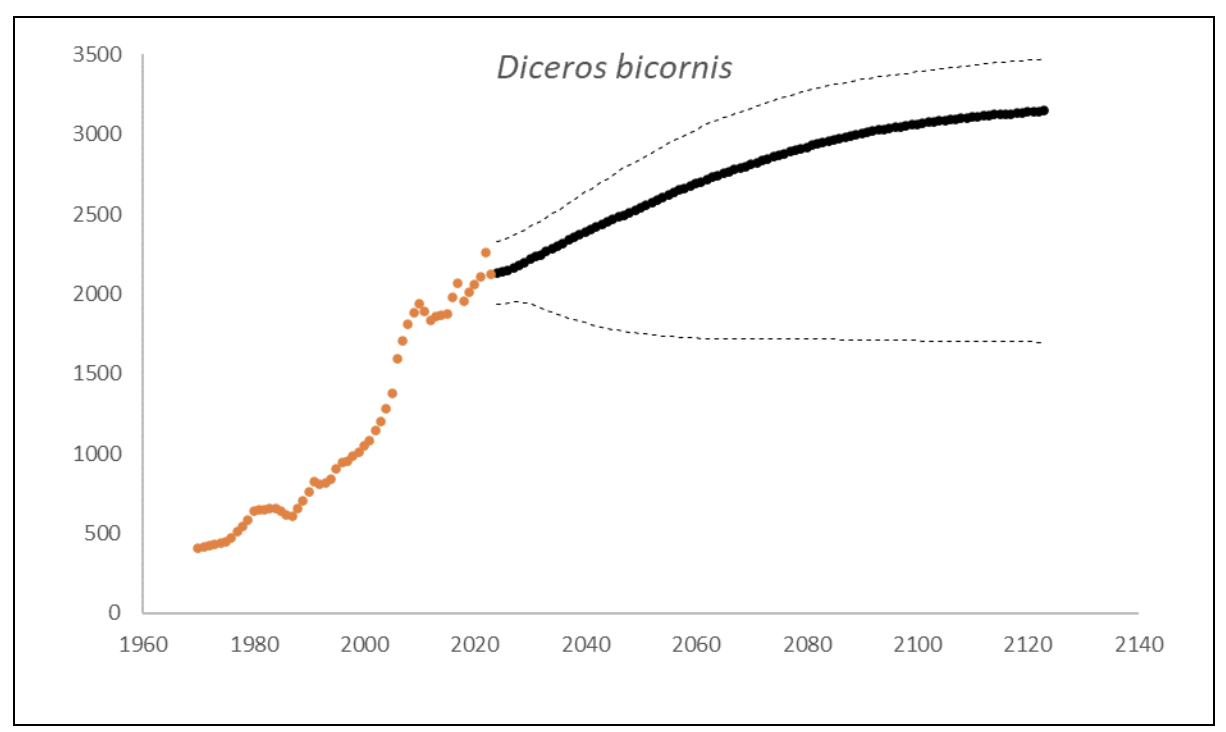
At the end of 2023, there were an estimated 2,147 (95% CI: 1,948-2,376) black rhino in South Africa and Eswatini, approximately 10% higher than what it was in 2015 (1,913, 90% CI: 1,817–1,970) (Emslie et al. 2016). The underlying annual growth that accounted for poaching impact was 5.6% (95% CI: 3.4%-7.7%) in the past generation since 2005. Together with an expected future poaching impact of 3.8% (95% CI: 2.6%-4.9%) and the estimated D. bicornis potential of 3,470 (95% CI: 3,379-3,559) individuals, underlying growth forecasted 2,869 (95% CI: 1,778-3,213) in 2074, three generations into the future (estimated for the longest generation time of 17 years). The species is calculated to have no extinction risk in the next 100 years (Box 1).
Box 1. Key population variables with 95% confidence intervals in brackets extracted for D. bicornis in the region. The coloured symbols are the p0int estimates of the number of individuals in the region. The dark symbols represent the forecasted estimates with the broken line the upper and lower confidence intervals of forecasted estimates.
| Variable | Value | ||
| Estimate 2023 | 2,147 (1,948 to 2,376) | ||
| Observed growth since 1971 | 3.5% (3.3% to 3.5%) | ||
| Underlying growth since 2005 | 5.6% (3.4% to 7.7%) | ||
| Area of extent | 1,092,227 km2 | ||
| Area of occupancy | 36,427 km2 | ||
| Number of populations | 77 | ||
| Mature individuals 2023 | 840 (760 to 928) | ||
| Average mature per subpopulation | 24 | ||
| % Mature in largest subpopulation | 17.4% | ||
| Predicted trend in 10 years | 1.0% (-0.4% to 2.1%) | ||
| Extinction risk in 100 years | 0.0% | ||
| Generation 10 years | Generation 14 years | Generation 17 years | |
| Population three generations ago | 844 | 547 | 414 |
| N in one generation | 2,266 (1,936-2,505) | 2,333 (1,900-2,571) | 2,385 (1,873-2,640) |
| N in two generations | 2,438 (1,855-2,703) | 2,571 (1,827-2,874) | 2,664 (1,807-2,991) |
| N in three generations | 2,602 (1,820-2,915) | 2,771 (1,793-3,125) | 2,869 (1,778-3,213) |
| Extinction risk in three generations | 0.0% | 0.0% | 0.0% |
| Extinction risk in five generations | 0.0% | 0.0% | 0.0% |
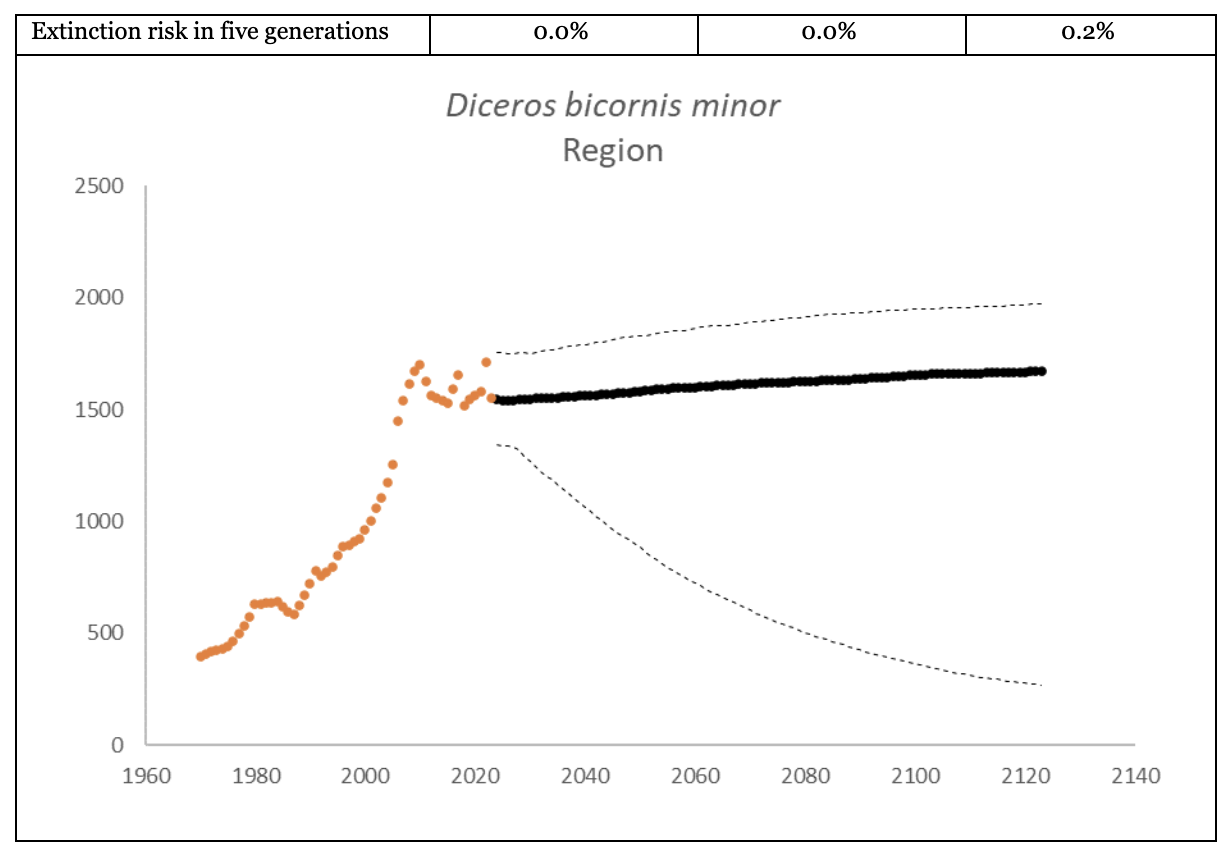
Southern-central Black Rhino D. b. minor
The region had 1,577 (95% CI: 1,376-1,799) individuals of D. b. minor living in South Africa and Eswatini at the end of 2023. The underlying growth, that accounted for poaching impact, was 4.2% (95% CI: 1.7%-6.8%) in the past generation since 2005. Together with an expected future poaching impact of 3.8% (95% CI: 2.6%-4.9%) and the estimated D. b. minor potential of 1,952 (95% CI: 1,855-2,051) individuals, underlying growth forecasted 1,608 (95% CI: 508-1,896) in 2074, three generations into the future (estimated for the longest generation time of 17 years). The sub-species had an extinction risk of 0.6% in the next 100 years (Box 2).
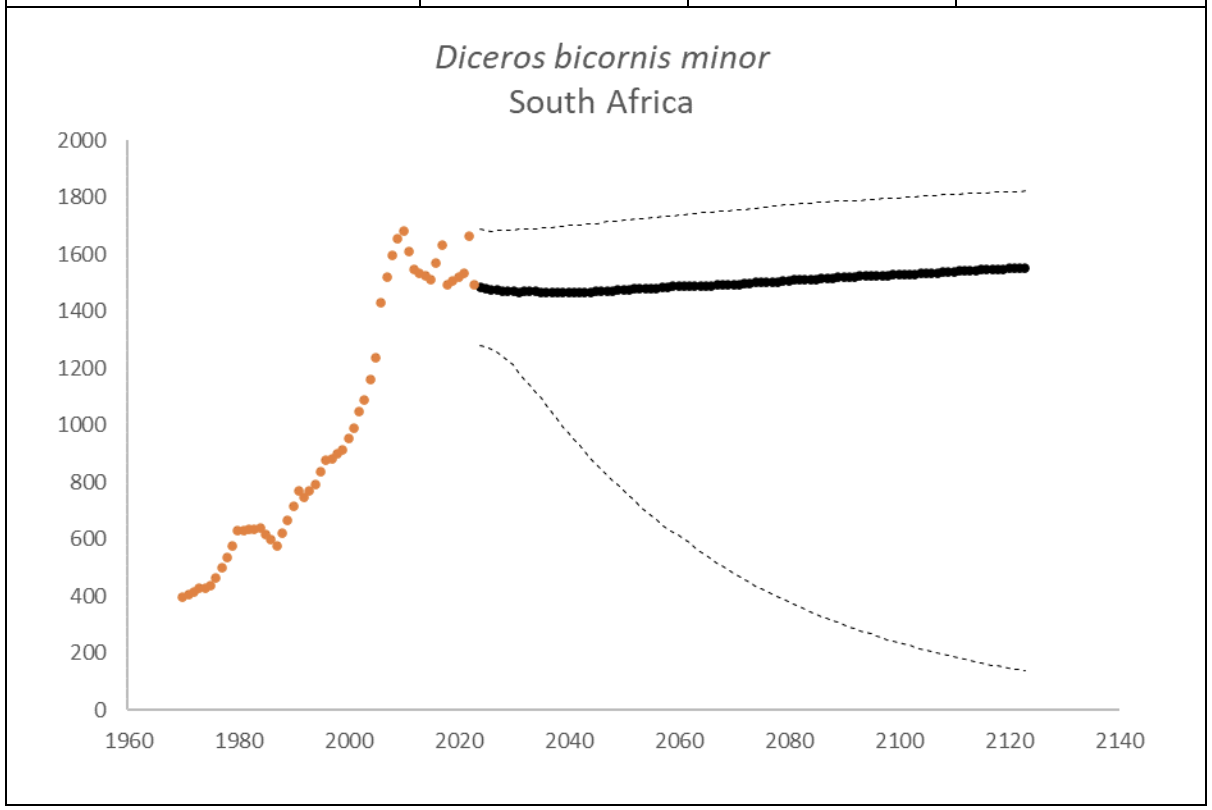
Box 2. Key population variables with 95% confidence intervals in brackets extracted for D. b. minor in the region. The coloured symbols are the point estimates of the number of individuals in the region. The dark symbols represent the forecasted estimates with the broken line the upper and lower confidence intervals of forecasted estimates.
| Variable | Value | ||
| Estimate 2023 | 1,577 (1,376 to 1,799) | ||
| Observed growth since 1971 | 3.0% (2.8% to 3.2%) | ||
| Underlying growth since 2005 | 4.2% (1.7% to 6.8%) | ||
| Area of extent | 420,306 km2 | ||
| Area of occupancy | 31,481 km2 | ||
| Number of populations | 68 | ||
| Mature individuals 2023 | 614 (535 to 702) | ||
| Average mature per subpopulation | 24 | ||
| % mature in largest subpopulation | 27.9% | ||
| Predicted trend in 10 years | -0.1% (-2.5% to 1.4%) | ||
| Extinction risk in 100 years | 0.6% | ||
| Generation 10 years | Generation 14 years | Generation 17 years | |
| Population three generations ago | 795 | 535 | 407 |
| N in one generation | 1,541 (1,209-1,782) | 1,555 (1,115-1,797) | 1,561 (1,060-1,804) |
| N in two generations | 1,565 (1,000-1,819) | 1,581 (850-1,839) | 1,586 (739-1,853) |
| N in three generations | 1,584 (811-1,844) | 1,599 (616-1,873) | 1,608 (508-1,896) |
| Extinction risk in three generations | 0.0% | 0.0% | 0.0% |
| Extinction risk in five generations | 0.0% | 0.0% | 0.2% |
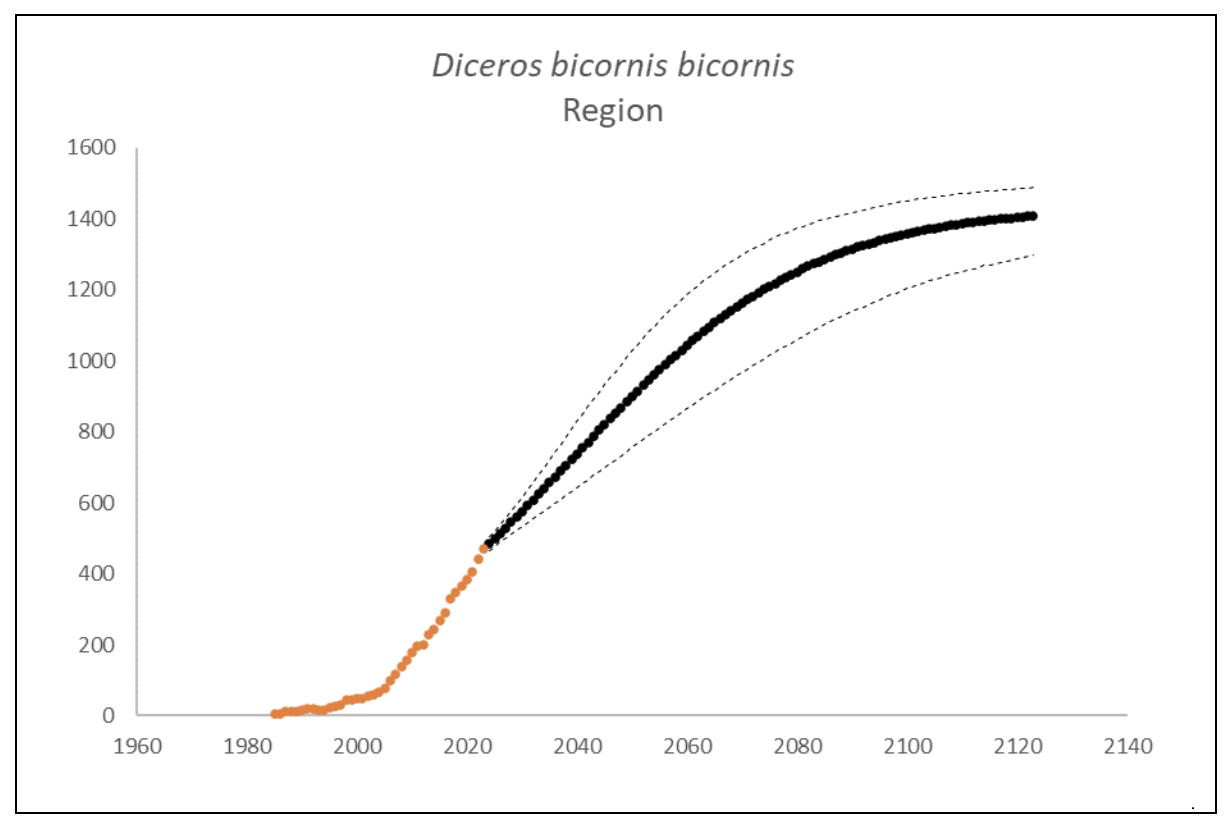
Southwestern Black Rhino D. b. bicornis
The region had 470 (95% CI: 451-488) individuals of D. b. bicornis that lived exclusively in South Africa at the end of 2023. The underlying growth that accounted for poaching impact was 8.3% (95% CI: 7.7%-8.8%) in the past generation since 2005. Together with an expected future poaching impact of 3.8% (95% CI: 2.6%-4.9%) and the estimated D. b. bicornis potential of 1,446 (95% CI: 1,371-1,520) individuals, underlying growth forecasted 1,202 (95% CI: 989-1,341) in 2074, three generations into the future (estimated for the longest generation time of 17 years). The sub-species had no extinction risk in the next 100 years (Box 3).
Box 3. Key population variables with 95% confidence intervals in brackets extracted for D. b. bicornis in the region. The coloured symbols are the p0int estimates of the number of individuals in the region. The dark symbols represent the forecasted estimates with the broken line the upper and lower confidence intervals of forecasted estimates.
| Variable | Value | ||
| Estimate 2023 | 470 (451 to 488) | ||
| Observed growth since 1971 | 11.5% (11.0% to 12.0%) | ||
| Underlying growth since 2005 | 8.3% (7.7% to 8.8%) | ||
| Area of extent | 671,570 km2 | ||
| Area of occupancy | 4,596 km2 | ||
| Number of populations | 8 | ||
| Mature individuals 2023 | 186 (179 to 194) | ||
| Average mature per subpopulation | 20 | ||
| % Mature in largest subpopulation | 57.5% | ||
| Predicted trend in 10 years | 2.8% (1.8% to 3.8%) | ||
| Extinction risk in 100 years | 0.0% | ||
| Generation 10 years | Generation 14 years | Generation 17 years | |
| Population three generations ago | 15 | 0 | 0 |
| N in one generation | 623 (565-684) | 689 (606-771) | 738 (638-838) |
| N in two generations | 788 (669-901) | 914 (756-1,057) | 1,003 (819-1,157) |
| N in three generations | 945 (777-1093) | 1,106 (902-1,260) | 1,202 (989-1,341) |
| Extinction risk in three generations | 0.0% | 0.0% | 0.0% |
| Extinction risk in five generations | 0.0% | 0.0% | 0.0% |
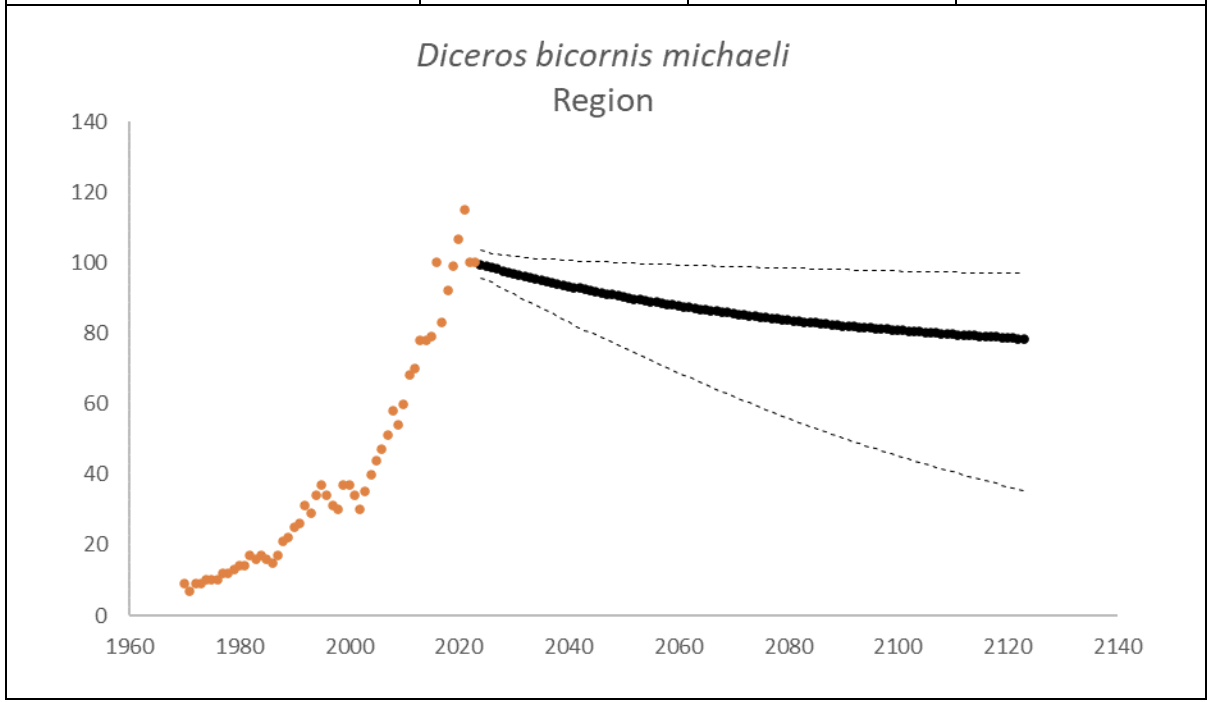
Eastern Black Rhino D. b. michaeli
The region had 100 (95% CI: 98-102) individuals of D. b. michaeli that lived exclusively on one property in South Africa at the end of 2023. The underlying growth that accounted for poaching impact was 4.7% (95% CI: 3.9%-5.5%) in the past generation since 2005. Together with an expected future poaching impact of 3.8% (95% CI: 2.6%-4.9%) and the estimated D. b. bicornis potential of 72 (95% CI: 69-76) individuals, underlying growth forecasted 85 (95% CI: 59-99) in 2074, three generations into the future (estimated for the longest generation time of 17 years). The sub-species had an extinction risk of 80% in the next 100 years (Box 4).
Box 4. Key population variables with 95% confidence intervals in brackets extracted for D. b. michaeli in the region. The coloured symbols are the p0int estimates of the number of individuals in the region. The dark symbols represent the forecasted estimates with the broken line the upper and lower confidence intervals of forecasted estimates.
| Variable | Value | ||
| Estimate 2023 | 100 (98 to 102) | ||
| Observed growth since 1971 | 5.0% (4.8% to 5.2%) | ||
| Underlying growth since 2005 | 4.7% (3.9% to 5.5%) | ||
| Area of extent | 350 km2 | ||
| Area of occupancy | 350 km2 | ||
| Number of populations | 1 | ||
| Mature individuals 2023 | 40 (39 to 41) | ||
| Average mature per subpopulation | 40 | ||
| % Mature in largest subpopulation | 100.0% | ||
| Predicted trend in 10 years | -0.4% (-1.1% to 0.0%) | ||
| Extinction risk in 100 years | 80.0% | ||
| Generation 10 years | Generation 14 years | Generation 17 years | |
| Population three generations ago | 34 | 12 | 7 |
| N in one generation | 96 (89-100) | 94 (86-100) | 93 (83-100) |
| N in two generations | 92 (81-100) | 90 (75-99) | 88 (70-99) |
| N in three generations | 89 (73-99) | 86 (65-99) | 85 (59-99) |
| Extinction risk in three generations | 80.0% | 80.0% | 80.0% |
| Extinction risk in five generations | 80.0% | 80.0% | 80.0% |
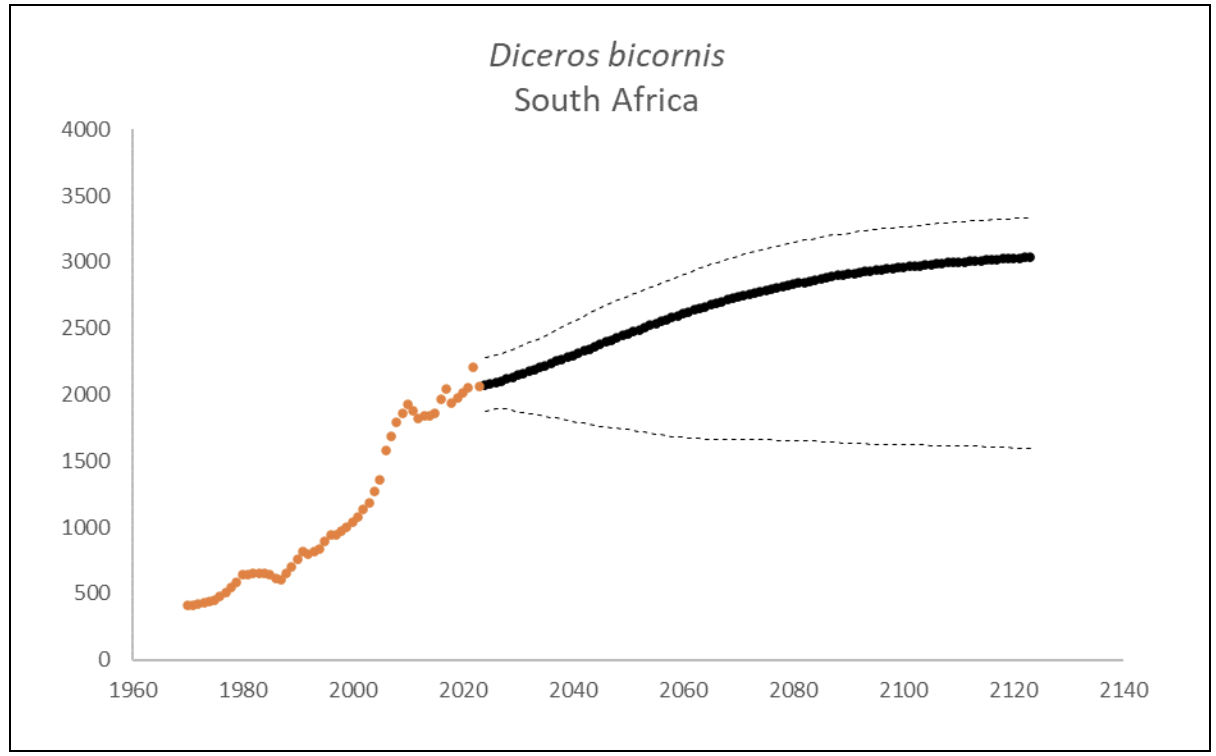
South African Populations
Black Rhino Diceros bicornis
At the end of 2023, South Africa had 2,065 (95% CI: 1,865-2,294) individuals of D. bicornis. The underlying growth that accounted for poaching impact was 5.5% (95% CI: 3.3%-7.7%) in the past generation since 2005. Together with an expected future poaching impact of 3.8% (95% CI: 2.6%-4.9%) and the estimated D. bicornis potential of 3,325 (95% CI: 3,158-3,495) individuals, underlying growth forecasted 2,767 (95% CI: 1,674-3,098) in 2074, three generations into the future (estimated for the longest generation time of 17 years). The species had no extinction risk in the next 100 years (Box 5).
Box 5. Key population variables with 95% confidence intervals in brackets extracted for D. bicornis in South Africa. The coloured symbols are the point estimates of the number of individuals in the region. The dark symbols represent the forecasted estimates with the broken line the upper and lower confidence intervals of forecasted estimates.
| Variable | Value | ||
| Estimate 2023 | 2,065 (1,865 to 2,294) | ||
| Observed growth since 1971 | 3.4% (3.3% to 3.6%) | ||
| Underlying growth since 2005 | 5.5% (3.3% to 7.7%) | ||
| Area of extent | 1,074863 km2 | ||
| Area of occupancy | 36,225 km2 | ||
| Number of populations | 75 | ||
| Mature individuals 2023 | 818 (739 to 909) | ||
| Average mature per subpopulation | 25 | ||
| % mature in largest subpopulation | 18.0% | ||
| Predicted trend in 10 years | 0.6% (-1.1% to 1.6%) | ||
| Extinction risk in 100 years | 0.0% | ||
| Generation 10 years | Generation 14 years | Generation 17 years | |
| Population three generations ago | 840 | 547 | 414 |
| N in one generation | 2,190 (1,853-2,425) | 2,253 (1,813-2,496) | 2,302 (1,787-2,558) |
| N in two generations | 2,351 (1,765-2,619) | 2,473 (1,722-2,776) | 2,560 (1,705-2,886) |
| N in three generations | 2,504 (1,716-2,814) | 2,665 (1,686-2,994) | 2,767 (1,674-3,098) |
| Extinction risk in three generations | 0.0% | 0.0% | 0.0% |
| Extinction risk in five generations | 0.0% | 0.0% | 0.0% |
Southern-central Black Rhino D. b. minor
South Africa had 1,522 (95% CI: 1,314-1,728) individuals of D. b. minor at the end of 2023. The underlying growth that accounted for poaching impact was 4.1% (95% CI: 1.5%-6.7%) in the past generation since 2005. Together with an expected future poaching impact of 3.8% (95% CI: 2.6%-4.9%) and the estimated D. b. minor potential of 1,807 (95% CI: 1,718-1,899) individuals, underlying growth forecasted 1,497 (95% CI: 400-1,763) in 2074, three generations into the future (estimated for the longest generation time of 17 years). The sub-species had an extinction risk of 2.1% in the next 100 years (Box 6).
Box 6. Key population variables with 95% confidence intervals in brackets extracted for D. b. minor in South Africa. The coloured symbols are the p0int estimates of the number of individuals in the region. The dark symbols represent the forecasted estimates with the broken line the upper and lower confidence intervals of forecasted estimates.
| Variable | Value | ||
| Estimate 2023 | 1,522 (1,314 to 1,728) | ||
| Observed growth since 1971 | 2.9% (2.7% to 3.1%) | ||
| Underlying growth since 2005 | 4.1% (1.5% to 6.7%) | ||
| Area of extent | 402,942 km2 | ||
| Area of occupancy | 31,279 km2 | ||
| Number of populations | 66 | ||
| Mature individuals 2023 | 592 (510 to 674) | ||
| Average mature per subpopulation | 27 | ||
| % mature in largest subpopulation | 29.3% | ||
| Predicted trend in 10 years | -0.2% (-2.9% to 1.2%) | ||
| Extinction risk in 100 years | 2.1% | ||
| Generation 10 years | Generation 14 years | Generation 17 years | |
| Population three generations ago | 791 | 535 | 407 |
| N in one generation | 1,467 (1,115-1,690) | 1,465 (1,026-1,696) | 1,468 (958-1,699) |
| N in two generations | 1,470 (889-1,702) | 1,477 (724-1,715) | 1,486 (626-1,731) |
| N in three generations | 1,482 (692-1,719) | 1,489 (503-1,746) | 1,497 (400-1,763) |
| Extinction risk in three generations | 0.0% | 0.0% | 0.0% |
| Extinction risk in five generations | 0.0% | 0.3% | 1.0% |
Southwestern Black Rhino D. b. bicornis
The sub-species is only present in South Africa and thus the features are the same as that noted for the region.
Eastern Black Rhino D. b. michaeli
The sub-species is only present in South Africa and thus the features are the same as that noted for the region.
Eswatini populations
Black Rhino Diceros bicornis
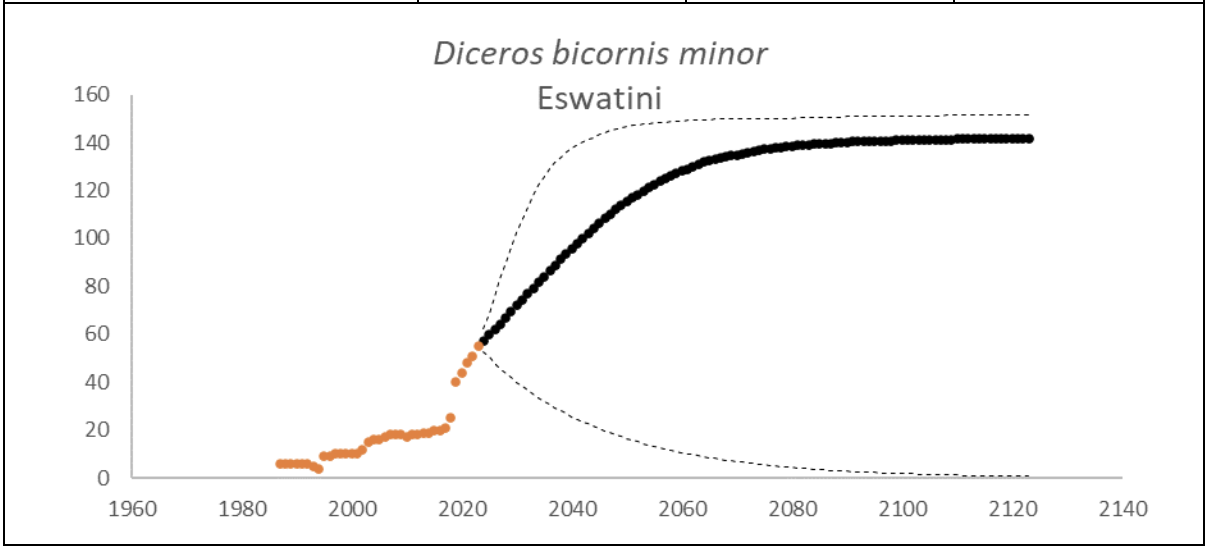
At the end of 2023, Eswatini had 55 (95% CI: 54-56) individuals of D. bicornis. The underlying growth that accounted for poaching impact was 7.2% (95% CI: 1.4%-13.0%) in the past generation since 2005. Together with an expected future poaching impact of 0.2% (95% CI: 0.0%-1.9%) and the estimated D. bicornis potential of 145 (95% CI: 137-152) individuals, underlying growth forecasted 137 (95% CI: 7-149) in 2074, three generations into the future (estimated for the longest generation time of 17 years). The sub-species had an extinction risk of 22.0% in the next 100 years (Box 7).
Box 7. Key population variables with 95% confidence intervals in brackets extracted for D. bicornis in Eswatini. The coloured symbols are the p0int estimates of the number of individuals in the region. The dark symbols represent the forecasted estimates with the broken line the upper and lower confidence intervals of forecasted estimates.
| Variable | Value | ||
| Estimate 2023 | 55 (54 to 56) | ||
| Observed growth since 1971 | 6.0% (5.4% to 6.6%) | ||
| Underlying growth since 2005 | 7.2% (1.4% to 13.0%) | ||
| Area of extent | 17,364 km2 | ||
| Area of occupancy | 202 km2 | ||
| Number of populations | 2 | ||
| Mature individuals 2023 | 22 (21 to 22) | ||
| Average mature per subpopulation | 10 | ||
| % mature in largest subpopulation | 56.3% | ||
| Predicted trend in 10 years | 3.8% (-4.0% to 7.7%) | ||
| Extinction risk in 100 years | 22.0% | ||
| Generation 10 years | Generation 14 years | Generation 17 years | |
| Population three generations ago | 4 | 0 | 0 |
| N in one generation | 80 (37-119) | 90 (31-132) | 97 (28-137) |
| N in two generations | 104 (24-141) | 117 (18-145) | 125 (14-148) |
| N in three generations | 120 (16-146) | 133 (10-149) | 137 (7-149) |
| Extinction risk in three generations | 58.8% | 35.4% | 42.4% |
| Extinction risk in five generations | 36.6% | 24.8% | 27.6% |
Southern-central Black Rhino D. b. minor
The sub-species is the only sub-species in Eswatini and thus the features are the same as that noted for Eswatini D. b. minor.
Population Information (D. bicornis)
| Continuing decline in mature individuals? | Qualifier | Justification |
| No | Estimated | Numbers estimated to be stable. Decreases for D. b. minor with probable decreases due to ongoing poaching and D. b. michaeli with rewilding translocations into their natural range being cancelled out by increases elsewhere. Numbers of D. b minor are likely to continue to increase. |
Extreme fluctuations in the number of subpopulations: Unlikely.
Continuing decline in number of subpopulations: There was an increase, and this is likely to continue.
All individuals in one subpopulation: No.
Number of mature individuals in largest subpopulation: This was less than 30% for any level of evaluation and likely to decrease.
Number of Subpopulations: At least 77 in the region.
Quantitative Analysis
Probability of extinction in the wild within 3 generations or 10 years, whichever is longer, maximum 100 years: 0.0% for D. minor in the region.
Probability of extinction in the wild within 5 generations or 20 years, whichever is longer, maximum 100 years: 0.0% for D. minor in the region.
Probability of extinction in the wild within 100 years: 0.0% for D. minor in the region.
Population genetics
Three surviving subspecies of black rhino (Diceros bicornis) are currently recognised (Emslie 2020): D. bicornis bicornis in Southwestern Africa. D. bicornis minor in Southeastern Africa, and D. bicornis michaeli in Central and Eastern Africa. A fourth subspecies, the Western Black Rhino (D. b. longipes), is now extinct (Lagrot et al. 2007). Several molecular studies have been conducted on this species, with varying sample sizes and molecular markers, making direct comparisons difficult.
An early molecular study (Harley et al. 2005) found genetic differentiation between the three subspecies, but samples were skewed and limited across the three groups. A recent genomic study examining historical genetic diversity identified six distinct genotype groups within Africa: Northwestern, Northeastern, Eastern, Central, Southern and a group from Ruvuma in Tanzania (Sánchez-Barreiro et al. 2023). The Central, Northeastern and Eastern genotype groups are associated with D. b. michaeli, while the Southern group comprises both D. b. bicornis and D. B. minor. The Northwestern genotype is associated with the extinct D. b. longipes. The historical clustering of Southern rhinos has led some to question the validity of D. b. bicornis and D. B. minor. However, further historic genetic substructure was detected within the Southern group, highlighting animals from Namibia as being genetically distinct. Regardless of their subspecific status, this evidence could support the protection of Namibian D. b. bicornis as a unique genetic entity.
Further historical substructure was also identified within the Central and Eastern groups, with a Masaailand, Northern Rift and eastern Rift population being identified in addition to a Central and Eastern group (Sánchez-Barreiro et al. 2023). Considerable admixture was detected suggesting natural gene flow likely took place across these areas followed a north–south genetic gradient. Additionally, there is evidence that the now-extinct D. b. longipes interbred with D. b. michaeli, mostly in the Masai Mara. Consequently, not all of the diversity within D. b. longipes has been lost. Efforts should be made to ensure this diversity it maintained throughout the Masai Mara, and potentially into other genetically depauperate populations to help boost their diversity.
Studies reporting the contemporary genetic diversity and structure of D. bicornis are few and restricted to specific regions. For example, Muya et al. (2011) examined the genetic diversity and structure within Kenya, which forms part of the Central and Eastern genetic groups and the D. b. michaeli subspecies. Extensive admixture was found across all sites examined largely owing to management efforts translocating animals across sites to enhance genetic diversity within each. The Masai Mara site, however, did show increased levels of a given genotype compared to all other sites, potentially reflecting different management efforts or historical mixing with D. b. longipes.
While two historical genetic groups were identified in Southern Africa, three groups are currently found, with animals in KwaZulu-Natal (KZN) appearing as another genetically distinct group (Moodley et al. 2017). This perceived increase in genetic structure is the result of population bottlenecks due to poaching and artificial isolation of animals that prevented their natural movement (gene flow). Over the past two decades, the Black Rhino Range Expansion Project (BRREP) in KZN has worked hard to enhance the genetic diversity within the province by tracking pedigrees and translocating individuals to minimize inbreeding. Additional efforts should consider expanding the genetic pool beyond KZN, by moving animals between KZN, other parts of South Africa and Zimbabwe, similar to what has been done in Kruger National Park (C. Harper, pers. comm. 2018).
Where possible, efforts should be made to collate and compare data from the various molecular studies or, if that’s not possible, utilize existing marker sets for future genetic monitoring purposes.
To quantify the genetic indicators, within the assessment region (South Africa, Lesotho, Eswatini), one historical genetically distinct population existed. Given the two current distinct populations, the populations maintained (PM) indicator would report a growth (i.e., 2/1 = 2.0); however, this is an artefact of a population bottleneck. Given the past bottleneck in the species, census numbers are not likely a true reflection of the effective population size (Ne); therefore, applying the ratio of 0.2 census: effective size (that quantified for white rhino) is not advised. Given the available data, actual measures of Ne ca be quantified and should be estimated to gain insight into the genetic health of each population of the species.
Habitats and ecology
Black rhinos occupy a wide variety of habitats from desert areas in Namibia to wetter forested areas. Highest densities are found in savannahs on nutrient-rich soils and in denser succulent valley bushveld areas. They are browsers and consume leaves and twigs of a wide range of species commonly favouring small acacias (Senegalia spp. and Vachellia spp.; preferably <1 m and not hidden by grass) and other palatable woody species as well as palatable herbs and succulents, such as plants from the Euphorbiaceae family.
For example, Southern-central Black Rhino occur in the bushveld habitats of Limpopo, Mpumalanga and KwaZulu-Natal (KZN) (Zululand thornveld and lowveld bushveld) (Skinner & Chimimba 2005). In Kruger National Park, where black rhinos are present at low densities (Ferreira et al. 2011), they prefer denser habitats (highest densities observed in the dense Sabie/Crocodile thickets). They require sufficient availability of suitable browse plant species in the right height classes, and permanent water.
Black rhinos demonstrate seasonal differences in space-use, both in home range size and utilisation (Plotz et al. 2016). Smaller home ranges and higher site fidelity in the dry season comes from limited surface water availability, with black rhinos restricting their range rather than expanding it under resource-limited conditions like in the dry season (le Roex et al. 2019). Black rhinos are resistant to drought with birth and death rates not associating with drought conditions (Ferreira et al. 2019). Within Kruger National Park, black rhino birth rates declined over a six-year period, potentially linked to Allee effects when cows and bulls do not have mating opportunities. This is typically the case in small declining populations that could experience poaching related social disruption and predator effects (le Roex & Ferreira 2020). In addition, poaching may create habitats that function as ecological traps for protected populations. This has been reported in Kruger National Park – ‘Threat’ areas represented ecological traps while ‘haven’ areas represented safe havens (le Roex et al. 2020).
Intraspecific conflict between rhino individuals may increase in areas where densities are high (Hitchins & Anderson 1983). High levels of secondary plant chemicals in some browse species and other indigestible components in many evergreen species, means that much of the available browse in some areas can be unsuitable for black rhino. Apart from plant species composition and size structure, black rhino dynamics link to rainfall, soil nutrient status, fire histories, levels of grass interference, extent of frost and densities of other large browsers (Emslie et al. 2009). Responses to environmental conditions and the presence of other rhinos can influence habitat use and vital rates (Greaver et al. 2014). For example, in Pilanesberg National Park within the North West Province of South Africa, the number of reproductive age cows successfully reproducing increased with increasing density until 0.085 individuals/km2 after which it declined (Hrabar & du Toit 2005). Individuals are routinely removed from such established subpopulations and introduced in new areas with suitable habitat and protection where new subpopulations can grow rapidly. This form of biological management has played a significant role in the expansion of range and numbers of black rhino (Sheriffs 2006).
Ecosystem and cultural services: Rhinoceroses are ecosystem engineers. Removing rhinos from the ecosystem may thus lead to trophic cascades (Everatt et al. 2016). They have also become a symbol of successful conservation of natural ecosystems and the ability of site managers and law enforcement officials to curb illegal wildlife trafficking (see Jooste & Ferreira 2018).
Culturally rhinos play important roles in symbolizing leadership. In some instances, this is reflected as sacred leadership (e.g., the Mapungubwe golden rhino), while in other cases it manifested in chief praise poetry and the use of rhino figurines as didactic tools during initiation schools (e.g., the Sotho-Tswana society). Use of rhino meat and horn was a marker of chiefly status. Rhino horns and bones played roles in rainmaking rituals. Architectural features in Zimbabwe and Venda reflected qualities of power, danger and protection traditionally associated with African leadership (Boeyens & van der Ryst 2014). Notably, national pride and social cohesion are arising as initiatives to save rhinos, and this has created a sense of shared ownership of the animals as a new South African-ness that may extend across traditional cultural lines (Kim 2021).
IUCN Habitats Classification Scheme
| Habitat | Season | Suitability | Major Importance? |
|---|---|---|---|
| 2.1. Savanna -> Savanna – Dry | – | Suitable | Yes |
| 3.5. Shrubland -> Shrubland – Subtropical/Tropical Dry | – | Suitable | Yes |
| 8.1. Desert -> Desert – Hot | – | Suitable | Yes |
Life History
| Generation Length | Justification | Data Quality |
|---|---|---|
| 10-17 years | See the above the methodology to estimate generation lengths. | – |
Age at maturity: female or unspecified: 6.75 years.
Age at Maturity: Male: 10 years.
Size at Maturity (in cms): Female: Not applicable.
Size at Maturity (in cms): Male: Not applicable.
Longevity: 35 years.
Average Reproductive Age: 17.1 years.
Maximum Size (in cms): Not applicable.
Size at Birth (in cms): Not applicable.
Gestation Time: 10-17 years.
Reproductive Periodicity: Calving interval 2.5 years anytime of the year.
Average Annual Fecundity or Litter Size: 1 calf.
Natural Mortality: ♂ age classes: A & B – 0.99, C – 0.94, D – 0.94, E – 0.64, F – 0.99; ♀ age classes: A & B – 0.99, C – 0.99, D – 0.99, E – 0.82, F – 0.99 from Ferreira et al. (2011). Age classes follow Emslie et al. (1995).
Does the species lay eggs? No.
Does the species give birth to live young: Yes.
Does the species exhibit parthenogenesis: No.
Does the species have a free-living larval stage? No.
Does the species require water for breeding? No.
Movement Patterns
Movement Patterns: Local resident with weak dispersal.
Congregatory: Non-gregarious.
Systems
System: Terrestrial.
General Use and Trade Information
The Convention on International Trade in Endangered Species of Wild Fauna and Flora (CITES), in late 2004, approved limited quotas allowing countries to hunt up to five specific individual surplus black rhino males each year in both South Africa and Namibia. These hunts needed to further demographic and/or genetic metapopulation goals. The quota was adapted in 2018 to 0.5% of the national total per annum of D. bicornis in South Africa (restricted to males) (CITES 2018). There is no hunting of black rhino undertaken in Eswatini.
South Africa used 69.2% (45 black rhino individuals hunted) of the total hunting quota available from 2005 to 2017. From 2018 to 2021, South Africa reported the hunting of two black rhinos, substantially lower than the full quota of 20. South Africa only implemented the newly adopted proportional quota setting in 2022. The fluctuating legal hunting rates ranged from zero to 0.13% in South Africa (Ferreira et al. 2022), substantially lower than natural mortality rates (e.g., 1.1% to 6.0%, Ferreira et al. 2021). The hunting of black rhino, albeit low numbers, has positively impacted on the national population by incentivising black rhino range expansion through translocations, and enhancing genetic and demographic conservation whilst also generating valuable income to help fund conservation efforts (‘t Sas-Rolfes et al. 2022).
Live black rhinos are legally bought and sold in South Africa. Between 2018 and 2021, several black rhinos were translocated across Africa (Ferreira et al. 2022), many of which originated from South Africa. These translocations largely form part of reintroduction programmes. For instance, South Africa has provided black rhinos as founders to Botswana, Chad, Malawi, Eswatini, Rwanda, Tanzania, Zambia, and Zimbabwe. Historically, South Africa provided a few black rhinos, mostly D. b. minor, to zoos, while D. b. michaeli and D. b. bicornis have been reintroduced to the wild from zoos. Eswatini sourced D. b. minor from South Africa but has no live trade of the species nationally or internationally.
Private ownership and community custodianship accounted for ~20% of black rhinos in South Africa at the end of 2021 (Ferreira et al. 2022) and ~24% at the end of 2023 (DFFE 2024). Black rhinos on communal or private land, however, are managed on a custodianship basis for the state. Since 2004, several new black rhino sites have been established on private and communal land facilitated by the World Wide Fund for Nature (WWF) Black Rhino Range Expansion Project (BRREP) (Sherrifs 2006).
Traditionally the direct use of black rhinos was viewed as limited to live sales and legal hunting. Recent insights, however, highlights use that carries tradition African medicinal values (e.g., several uses of rhino dung, DFFE 2024). In South Africa and Eswatini, revenue linked through viewing and experiential tourism, as well as external support through non-government organizations, funding agencies, and philanthropic donations support conservation activities and businesses (Ferreira et al. 2022). The economic cascades, however, are not quantified. For instance, funding sourced through donations and external fund raising supports a robust rhino security industry. An estimated 7.0 to 7.4% of 3,155,265 people living next to Kruger National Park benefited directly or indirectly by 2018 (Jooste & Ferreira 2018). Numerous non-government entities continue to raise funds and awareness about rhinos globally. An additional use is the leveraging value to enhance the well-being of local people. South Africa is implementing the transformation of the country’s wildlife economy. This programme seeks to distribute equitable opportunities and enhance a vibrant wildlife industry within which black rhinos play a key role.
| Subsistence: | Rationale: | Local Commercial: | Further detail including information on economic value: |
| No | – | Yes | Very limited hunting does not usually occur in formal protected areas or BRREP sites. Private owners sell surplus rhino. Most surplus live black rhino currently used as founders for new populations. |
National Commercial Value: Yes
International Commercial Value: Yes
| End Use | Subsistence | National | International | Other |
| 1. Food – human | True | True | – | – |
| 3. Medicine – human & veterinary | – | True | True | – |
| 12. Handicrafts, jewellery, etc. | – | True | True | – |
| 15. Sport hunting/specimen collecting | – | True | True | – |
Is there harvest from captive/cultivated sources of this species? No.
Harvest Trend Comments: Not relevant.
Threats
Black rhino future trends are likely to be impacted by three key global environmental change drivers – overharvesting, habitat changes, and climate changes (Ferreira et al. 2024d). The primary threat to black rhinos in the short- to medium-term is the illegal killing of individual rhinos for their horn which is trafficked to meet the demand for horn products in parts of Southeast Asia (Eikelboom & Prins 2024). Rhino poaching surged in 2007 and peaked in 2015 before declining to a contemporary low in 2020 (Ferreira et al. 2022). Poaching rates have remained relatively stable since then (Ferreira et al. 2024b). Importantly, the recent poaching rates are below the threshold of 3.5% of the population beyond which black rhino numbers will decline (Ferreira et al. 2022).
Before the onset of the recent poaching surge (Thomas 2010), black rhinos were performing well in Kruger National Park (Ferreira et al. 2011) with a detectable decline by 2016 (Ferreira et al. 2018). The decline stopped and in recent times black rhino populations may have been maintained (Ferreira et al. 2024c). Despite poaching, South Africa recorded an increase in black rhino numbers from 2020 to 2023 (Ferreira et al. 2024b). Note there has been no rhino poaching in Eswatini since 2014 and black rhino numbers have been increasing. The impact of poaching and trafficking is that safe rhino habitats are the priority requirement (e.g., Ferreira et al. 2024d). Part of this links to limited considerations for alternative models of providing rhino security – at present most focus on intensive militarized approaches.
Prices for illegal rhino horns ranged between US$3,000 and US$7,500 per kilogram within South Africa from 2018 to 2022 with no clear trend (Ferreira et al. 2022). In consumer countries the price declined from between US$20,000 and US$22,000 per kilogram in 2016 to between US$10,000 and US$14,000 per kilogram in 2021/2022 (WJC 2022). Drivers and enablers of poaching include long histories of culturally embedded trade, price inelasticity, inadequate law enforcement, unclear property rights and human-wildlife conflict disincentives (Conrad 2012). An additional driver, profit potential, is particularly attractive to transnational organized crime. Inherently this equates to corruption at various levels. Corruption in the networks involved in rhino conservation (for example, game farmers, veterinarians, and park rangers, as well as law enforcement officials) enhances the resilience of criminal syndicates by supplying criminals with false documentation, laundering facilities for wildlife or products, and transport and holding facilities (Ayling 2013).
Medium- to longer-term threats faced by rhinos include habitat transformation due to human activities (Watson et al. 2016). Forecasted human population trends and activities predict 77.65% further habitat transformation by 2122 (Ferreira et al. 2024d). The influence of climate change on the ranges of most species (Beyer & Manica 2020) predicts 36.0% (35.0% to 37.2%) of the range of black rhinos lost due to climate change by 2122 (Ferreira et al. 2024d).
These losses will constrain available habitat to potentially accommodate 3,628 (3,206 to 4,109) D. b. bicornis, 7,257 (6,413 to 8,218) D. b. minor and 7,257 (6,413 to 8,218) D. b. michaeli in future. Potential exists for a further 3,628 (3,206 to 4,109) black rhinos of any sub-species (or blend of sub-species) could live within the range of the now extinct D. b. longipes (Ferreira et al. 2024d).
Conservation
Eswatini implements a National Rhino Conservation Strategy with aspirations to have at least one population that exceeds 100 individuals (Big Game Parks 2010). South Africa implemented a national Biodiversity Management Plan for black rhinos since 2011 (Knight et al. 2011). The plan expired in 2020, and South Africa reviewed and produced a draft integrated national Biodiversity Management Plan for Rhinos (DFFE 2024). South Africa’s aspirations evolved from “Contribute to the recovery and long-term persistence of the global black rhino population by having viable populations of the indigenous sub-species in natural habitat throughout their former range within South Africa and managed as part of a regional meta-population” (Knight et al. 2011) to “Thriving national herds of wild black and white rhino are valued, promote conservation, and people benefit from their inclusive sustainable use” (DFFE 2024). The revised goal focuses on “cooperatively managing a viable, secure and expanding national metapopulation of both species of indigenous rhino in order to contribute to national biodiversity objectives, meet a range of societal values, and advance transformation through inclusive ownership, meaningful participation and broad beneficiation”. The emphasis is on integrated systems compared to the previous focus on growth and rhino numbers – i.e., “an average South African meta-population growth rate for both of the two indigenous sub-species of black rhino of at least 5% per annum, and Meta-population sizes in South Africa of at least 2,800 for D. b. minor and 260 for D. b. bicornis by the end of 2020”.
The two key elements of innovative biological management and security, law enforcement and crime disruption remain, specifically for South Africa. Rhino management plans in the region place different levels of emphasis on the participation by local communities – ranging from local people being considered to local people meaningfully participating, benefiting from, and valuing black rhinos. Both South Africa and Eswatini envisage benefiting from rhino horn trade when rhino populations are secure, and governance conditions are conducive for international trade. A key aspect in the South African plan includes access by all citizens to a diversity of cultural values that rhinos have. Supporting or enabling objectives include financing, capacity and responsive legislation, policies, and regulations.
Biological management: Management responses that facilitated range expansions have played a key role in recovering black rhino (Knight et al. 2011). These efforts focussed on, and to some extent still do, the strategic removal of rhinos from landscapes with high densities (where density-dependent population regulation may be operating) and moving these rhinos to lower density landscapes (Greaver et al. 2014). This approach can stimulate growth rates in both those landscapes, in line with the constant harvest strategy advocated for high-density black rhino subpopulations (Knight et al. 2011). The Black Rhino Range Expansion Project (BRREP) utilised this approach to initiate the restoration of D. b. minor populations within the historic range of the species (Sherriffs 2006). The BRREP initiative continues and has expanded to function beyond the boundaries of the region.
The BBREP model utilised well-established populations (initially those in KwaZulu-Natal) as source areas to supply recipient areas with founder rhinos. Guidelines for the programme focused on establishing many populations (i.e., expanding black rhino range) using at least 20 unrelated founders in each new site (Emslie et al. 2009) and thus have some a genetic diversity at the start. The BBREP initiative continues to follow these guidelines and benefits from having some relatively large populations such as those in KwaZulu-Natal and the Eastern Cape, with the potential for Kruger National Park and Eswatini contributing to the initiative in future.
Recent developments have seen the establishment of the Desert Rhino Action Group (DRAG), an initiative that seeks to enhance the collaboration among managers and socio-ecological contributions of D. b. bicornis (Dave Balfour, Personal communications). DRAG focuses on collaboratively managing the few populations that are currently dispersed across the western half of South Africa under state and private management. The DRAG initiative utilises an ecological framing of how species would persist in fragmented landscapes guided by metapopulation theory (Hanski 1999). This considers three conditions: (1) populations should occur in discontinuous units across their range; (2) population variables for the units should differ; and (3) dispersal should occur between these units (Olivier et al. 2009).
South Africa envisages thriving biodiversity and thriving people in a White Paper on the conservation and sustainable use of the country’s biodiversity (DFFE 2023). The White Paper includes concepts such as living landscapes that focuses on managing land at the ecosystem-scale to benefit people, wildlife, and the economy (Steiner 2012). New initiatives are seeking opportunities for black rhinos in this context. The insights to manage fragmented rhino populations within a metapopulation framework underpins the revised aspirations for South Africa as it also provides a framing for range expansion goals of BRREP and DRAG as the key aspects link to establishing dispersal dynamics by ether maintaining ecological opportunities, if not restoring those, if not mimicking dispersal i.e., translocations of individuals likely to disperse. In the evolving socio-ecological context and expectations from stakeholders, such approaches help optimise black rhino contributions to living landscapes while managing populations linked as a network and place less emphasis on founder concepts. Importantly, it allows establishing new subpopulations while also widening the existing ownership basis (Ferreira et al. 2022) and hence shared interest in protection of the species.
Genetic risks do realise in small populations through inbreeding (e.g., Hutu et al. 2020) and genetic drift (e.g., Masel 2011) accentuated by managing populations in isolation (e.g., Kanitz et al. 2018). The BBREP initiatives and approaches used and advocated by DRAG seek to reduce present and future genetic risks within D. b. minor (e.g., Stanbridge et al. 2023) or D. b. bicornis (e.g., Harley et al. 2005). It is not clear what genetic risks realised in the one extra-limital population of D. b. michaeli in South Africa, or what genetic risks may realise in the two populations of D. b. minor within Eswatini. Even so, such risks, if realised, can easily be addressed through supplementary introductions and/or removals of individual black rhinos.
Disease presents risk to black rhinos on two fronts. Although black rhinos are exposed to several infectious diseases (Fisher-Tenhagen et al. 2000), these carry low risks for population persistence. Isolated cases of the tickborne babesiosis have caused deaths of rhinos (e.g., Mills et al. 2006). Such risks can be reduced through prophylactic actions especially when individuals are relocated for metapopulation management purposes (Zimmermann et al. 2021). A more significant challenge arises out of national disease regulations. For instance, cases of black rhinos with bovine tuberculosis (e.g., Dwyer et al. 2020) raise concerns linked to detrimental implications for wildlife conservation at large should infected animals be moved to uninfected areas (Miller et al. 2017). These carry key concerns when there are risks of wildlife sources infecting commercial livestock. A consequence is that several protected areas are quarantined under disease regulations and practices (Davey 2023) limiting translocations options that support range expansion and metapopulation management even though the risk of spillback from wildlife to livestock have low likelihoods of occurrence (De Garine-Wichatitsky et al. 2013).
A unified framing for metapopulation management provides strong guidance for managing when a network of subpopulations is well established, or subpopulations are dynamic and robust. It suggests mimicking colonisation of new areas by assisting dispersal dynamics through translocations that prioritise close geographic sources to accommodate the new insights on geographic genetic structure of black rhinos (Moodley et al. 2017; Sánchez-Barreiro et al. 2023). For localities that already have black rhinos the goal is to ensure ecological robustness in fragmented landscapes. This also focuses on mimicking dispersal, prioritising moving individuals with at least one dispersal event between places that are geographically close per generation. Managing for such ecological dynamics predicts a favourable genetic outcome. Monitoring needs to be done to confirm this.
Rhino protection, safety and security: Effective protection of rhino populations remains critical. Increasing numbers of rhinos are now concentrated in fenced areas at higher than natural densities e.g., sanctuaries, conservancies, rhino conservation areas and intensive protection zones where law enforcement effort can be concentrated at cost effective levels. Anti-poaching campaigns and operations alone, however, may not reverse the poaching trend in Kruger National Park (KNP) (Ferreira et al. 2015), as intensive anti-poaching programmes have at best to date slowed the escalation of poaching rates (Humphreys & Smith 2014). Three critical insights provide guidance. First, across the continent, black rhino populations performed better in management models that had some or other form of partnership including private, non-government organizations and government agencies than those under pure-state management (Ferreira et al. 2022). Second, rhinos at sites located in regions with relatively good governance typically perform better. Hluhluwe-iMfolozi Park and Kruger National Park, both of which have experienced past and present poaching onslaughts which are likely to continue (Eikelboom & Prins 2024), are embedded in regions experiencing substantial governance challenges and high crime rates (e.g., Rademeyer 2023). Third, across the continent, it also appears that rhinos in smaller areas tend to do better (are more effectively buffered from poaching) than those in large areas. This may link to area-size related cost-efficient access control, situational awareness, staff integrity and intensive monitoring of rhinos (Ferreira & Dziba 2021).
Few evaluations check effectiveness of rhino protection initiatives, but given the critical insights, it is not surprising that armed rangers are not sufficient for deterring poaching attempts (Barichievy et al. 2017) and poaching pressure remains high in many areas despite intensive anti-poaching (Eikelboom & Prins 2024). Anti-poaching interventions that directly target rhinos are thought to be more effective – within the reserves under the Greater Kruger Environmental Protection Forum, dehorning that reduces the attractiveness of a rhino to potential poachers had significant effects on rhino poaching rates (Kuiper et al. 2024). It is clear though that dehorning of rhino is unlikely to be a viable or long-term solution on its own and must complement the suite of anti-poaching tactics (Lindsey & Taylor 2011). In addition, dehorning is costly and is unlikely to be sustainable under the present governance and funding conditions and is at best a stop-gap practice while seeking to address the suite of underlying drivers including long histories of trade in rhino horn, inelastic prices of illegal products, high profit potentials, inadequate law enforcement, unclear property rights and human-wildlife conflict disincentives (Conrad 2012).
Similarly, strategic rhino removals from focal areas that are heavily targeted by poachers to areas of lower risk could reduce poaching rates as a stop-gap measure. For example, it may be advisable to move rhinos from poaching hotspots close to international boundaries that provide ample escape opportunities for the poachers towards areas and with easier access for management patrols and anti-poaching operations. Such removals also have the additional benefit of focusing management actions over smaller areas (Ferreira et al. 2024c). In addition, it could offset anticipated poaching effects through induced lower mortalities and higher birth rates because of lower local densities (Rachlow & Berger 1998). Such strategies may thus result in positive growth rates both in the source and in the recipient sites.
Enforcement and stop-gap measures are not sustainable in the long-term as the scale of the economic drivers behind poaching is likely to overwhelm regulatory and law enforcement mechanisms (Challender & MacMillan 2014). Long-term solutions to the poaching challenge requires integrated approaches, aside from the anti-poaching approach, to reduce the poaching threat (Ferreira & Okita-Ouma 2012; Ferreira et al. 2014). In addition, greater use of technology, especially in very large areas where it is not possible to have one field ranger per 7 to 10 km2, could assist the protection of rhinos (Chanyandura et al. 2021). Some of these technologies include use of opportunities such as predictive patrolling (Haas & Ferreira 2018), the use of dogs for various purposes as well as detection technologies (Kaminga et al. 2018) and artificial intelligence (e.g., Chalmers et al. 2019).
Cooperation between key stakeholders is a key requirement. In addition to local and national initiatives, there are several regional African rhino conservation initiatives that South Africa and Eswatini are part of: the SADC RMG, and the SADC Rhino and Elephant Security Group (RESG)/Interpol Environmental Crime Working. South Africa implements the National Integrated Strategy to Combat Wildlife Trafficking. South Africa has identified seven wildlife zones focusing on four areas of intervention: (1) Promote national coordination; (2) Sharing of knowledge; (3) Joint protection; and (4) Strengthening the national picture on wildlife crime. Eswatini reviewed penalties and have substantially increased fines and jail terms linked to rhino crimes.
A key aspect of protecting rhinos requires a focus on collecting and analysing statistics such as incursion, arrests, convictions and legal sanctioning of fines and jail time with a key assumption that these act as deterrents. Several practitioners have raised concerns that fines may be viewed as a minor tax on turnover of criminal syndicates. Handing down of custodial sentences is more likely to act as a deterrent. Yet, despite many arrests and convictions (Minnaar & Herbig 2018), poaching pressure remains high (Eikelboom & Prins 2024). Some advocate for more follow-up legal actions such as asset forfeiture and civil actions targeting the higher ranking members of the criminal syndicates (e.g., Geldenhuys 2016).
Within the region, the dominant social narrative has been emphasising “winning the poaching war” (Duffy 2014) which refers to a “finite” game (where rules exist, keeping score is easy, the opposition are known and there is a set time period for the game) (Sinek 2019). Most rhino sites, however, encounter the rules of an “infinite” game (rules are uncertain and circumstances change frequently, progress is difficult to measure, opponents regularly adapt to changing conditions and there is no end to the game). Future approaches that align with tactics to outlast all others and thereby leave a legacy (Sinek 2019) could be a key requirement to reduce poaching pressure.
Demand management and trade: Black rhinos are listed on CITES Appendix I since 1977. All international commercial trade in black rhinos and their products is prohibited. To help reduce illegal trade, and complement the CITES international trade bans, domestic anti-trade measures and legislation were implemented in the 1990s by several consumer States. Since CITES CoP13 (2004), limited sport hunting quotas have been approved for up to five surplus males annually (to further genetic and demographic conservation management goals) for the two range states with biggest populations (South Africa and Namibia). This quota was adapted to 0.5% of the annual male population in 2018 for South Africa.
Discussions on international legal trade are predominantly based on strong opinions. Some advocate that legal international trade in rhino horn could form part of a solution to the impacts of poaching on rhino populations (e.g., Biggs et al. 2013), others use scenario planning (e.g., Ferreira et al. 2014) and modelling forecasts (De Minin et al. 2015; Haas & Ferreira 2016). Most arguments for trade in rhino horn focus on the need to raise capital for reinvestment into rhino conservation. Alternative opinions focus on reducing demand and lobby through social marketing, education and intergovernmenta cooperation arguing that the market is not well understood and that legal trade in rhino horn only creates opportunities for criminal laundering and thus worsens the rhino poaching situation (e.g., Collins et al. 2013; Nadal & Aguayo 2014; Challender & MacMillan 2014; Olmedo 2015; Crookes & Blignaut 2015).
Although there have been many “demand reduction” campaigns seeking to reduce the consumer demand for rhino horn, the relative impacts of these are unclear and likely limited (Vu & Nielsen 2021). Some case studies suggest relative low uptake and behaviour change (Vu et al. 2020) although it is not clear how general this is. South Africa seeks to focus on demand management that promotes sustainable legal demand, while reducing illegal demand (DFFE 2024). In this context, South Africa allows domestic legal trade in rhino horn, but the uptake was low (Ferreira et al. 2022) as most consumers are primarily international. There are concerns that the capacity to regulate a legal trade is inadequate to prevent the laundering of illegal horn and subsequent increased poaching of wild animals (e.g., Taylor et al. 2014; Bennett 2015). A case study making use of a choice experiment in Vietnam concluded that legal trade in rhino horn would likely continue to face competition from a parallel black market (Vu et al. 2022). An outcome is that the appetite for international trade at the global scale has been diminishing. Eswatini requested in 2018 and 2022 to be allowed to trade a small amount of the country’s rhino horns. Both proposals were rejected by the CITES conference of the Parties (CoP18 and CoP19).
Forecast modelling suggests that disrupting organised crime while also creating alternative economic opportunities for people are key requirements to conserve rhino populations (Haas & Ferreira 2016). South Africa’s Committee of Inquiry on rhino horn trade (2014) recommended that international trade proposals should only be considered when governance conditions are conducive (which remain undefined) – this is a key directive within South Africa’s rhino conservation and utilisation aspirations. Some of these governance conditions link to the traceability of rhino products and derivatives, particularly horn. Recently, a startup company, Rhinomics (https://rhinomics.com/) established a structured process of achieving traceability in several southern African countries including South Africa. An intention is that a portion of the revenue generated through the legal sale of rhino horn will go directly to the sites which are managing the rhinos from which the horn was derived. Provision is also being made to channel funds from the legal sale of these horns to communities living on the borders of rhino conservation sites.
Game-changing interventions addressing transnational crime: Disrupting organised crime is a key element in efforts to combat illegal wildlife crime, including rhino horn markets. Previously rhino horn poachers and traffickers were relatively unsophisticated and informal, but these activities have now evolved and there are highly organised criminal syndicates that are resilient to disturbance (Ayling 2013). This necessitates the targeting of key higher-level players by law enforcers. Tools such as the use of social network analysis (Haas & Ferreira 2015), as well as congruent legal tools, including extradition agreements between the countries targeted by poachers and those harbouring poachers and horn dealers (Ferreira & Okita-Ouma 2012) can be key. The implementation of security, including the adoption and implementation of the National Integrated Strategy to Combat Wildlife Trafficking in South Africa and intelligence-based operations in Eswatini, which recognise systematic elements of the crime, are thus important and potential game changers.
Game changing interventions providing diverse livelihood opportunities: Increasing efforts are being made to integrate local communities into conservation management and associated benefits. This approach, now strongly emphasised within South Africa’s aspirations (DFFE 2024) as well as Eswatini (BGP 2010), seeks to increase the value that a larger number of citizens experience from rhino. Black rhino ownership in South Africa is primarily by the state (~80%, Ferreira et al. 2022). Private ownership and community custodianship, provide opportunities to establish and grow a range of economic and livelihood opportunities based on rhinos. Important issues include the devolving of decision-making and ownership of rhinos to private and community actors and providing incentives and legislative tools to support bottom-up markets for legal hunting and trade that support rhino conservation (Child 2012). Multiple cultural values enhance the livelihoods of Africans (Boeyens & van der Ryst 2014) and some of these provide opportunities to integrate rhinos into socio-economic transformation aspirations, particularly in South Africa (DFFE 2024), including the use of rhino derivatives locally. A key element is meaningful participation by principally affected stakeholders that favours co-management and accountability for rhinos. Approaches seek to, through co-management, support community involvement and benefit sharing from rhino conservation.
Bibliography
’t Sas‐Rolfes, M., Emslie, R., Adcock, K. & Knight, M. 2022. Legal hunting for conservation of highly threatened species: The case of African rhinos. Conservation Letters, 15(3), p.e12877.
Ayling J. 2013. What Sustains Wildlife Crime? Rhino Horn Trading and the Resilience of Criminal Networks. Journal of International Wildlife Law & Policy 16: 57-80.
Barichievy, C., Munro, L., Clinning, G., Whittington-Jones, B. & Masterson, G. 2017. Do armed field-rangers deter rhino poachers? An empirical analysis. Biological Conservation, 209, pp.554-560.
Bennett, E.L. 2015. Legal ivory trade in a corrupt world and its impact on African elephant populations. Conservation Biology 29(1): 54–60. DOI: 10.1111/cobi.12377.
Beyer, R.M. & Manica, A. 2020. Historical and projected future range sizes of the world’s mammals, birds, and amphibians. Nature Communications, 11(1), p.5633.
Big Game Parks. 2010. Swaziland National Rhino Conservation Strategy. The Kingdom of Swaziland (now Eswatini).
Biggs, D., Courchamp, F., Martin, R. & Possingham, H.P. 2013. Legal trade of Africa’s rhino horns. Science 339: 1038-1039.
Boeyens, J.C. & van der Ryst, M.M. 2014. The cultural and symbolic significance of the African rhinoceros: a review of the traditional beliefs, perceptions and practices of agropastoralist societies in southern Africa. Southern African Humanities, 26(1), pp.21-55.
Challender, D.W.S. & MacMillan, D.C. 2014. Poaching is more than an enforcement problem. Conservation Letters 7: 484–494.
Chanyandura, A., Muposhi, V.K., Gandiwa, E. & Muboko, N. 2021. An analysis of threats, strategies, and opportunities for African rhinoceros conservation. Ecology and Evolution, 11(11), pp.5892-5910.
Charlesworth, B. 1994. Evolution in Age-structured Populations. Cambridge: University of Cambridge Press. pp. 28–30. ISBN 978-0-521-45967-9.
Chalmers, C., Fergus, P., Wich, S. & Montanez, A.C. 2019. Conservation AI: Live stream analysis for the detection of endangered species using convolutional neural networks and drone technology. arXiv preprint arXiv:1910.07360.
Child B. 2012. The sustainable use approach could save South Africa’s rhinos. South African Journal of Science 108: 21-25.
CITES. 2018. Establishment of export quotas for black rhinoceros hunting trophies. Conf. 13.5 (Rev. Cop18). https://cites.org/sites/default/files/documents/COP/19/resolution/E-Res-13-05-R18.pdf
Clarke, S.H., Lawrence, E.R., Matte, J.M., Gallagher, B.K., Salisbury, S.J., Michaelides, S.N., Koumrouyan, R., Ruzzante, D.E., Grant, J.W. & Fraser, D.J. 2024. Global assessment of effective population sizes: Consistent taxonomic differences in meeting the 50/500 rule. Molecular Ecology, 33(11), p.e17353.
Collins, A., Fraser, G. & Snowball, J. 2013. Rhino poaching: supply and demand uncertain. Science 340: 1167-1167.
Conrad, K. 2012. Trade bans: a perfect storm for poaching? Tropical Conservation Science, 5(3), pp.245-254.
Crookes, D.J. & Blignaut, J.N. 2015. Debunking the myth that a legal trade will solve the rhino horn crisis: A system dynamics model for market demand. Journal for Nature Conservation 28: 11-18.
Davey, S. 2023. Challenges to the control of Mycobacterium bovis in livestock and wildlife populations in the South African context. Irish Veterinary Journal, 76(Suppl 1), p.14.
De Garine-Wichatitsky, M., Caron, A., Kock, R., Tschopp, R., Munyeme, M., Hofmeyr, M. & Michel, A. 2013. A review of bovine tuberculosis at the wildlife–livestock–human interface in sub-Saharan Africa. Epidemiology & Infection, 141(7), pp.1342-1356.
Di Minin, E., Laitila, J., Montesino‐Pouzols, F., Leader‐Williams, N., Slotow, R., Goodman, P.S., Conway, A.J. & Moilanen, A. 2015. Identification of policies for a sustainable legal trade in rhinoceros horn based on population projection and socioeconomic models. Conservation Biology, 29(2), pp.545-555.
DFFE. 2023. White Paper on the conservation and sustainable use of South Africa’s biodiversity. Government Gazette, Republic of South Africa, No 48785, 2-43.
DFFE. 2024. Draft Biodiversity Management Plan for black rhinoceros (Diceros bicornis) and white rhinoceros (Ceratotherium simum) in South Africa. Government Gazette, Republic of South Africa Vol 708, No 50829, 5-116.
Dwyer, R.A., Witte, C., Buss, P., Goosen, W.J. & Miller, M. 2020. Epidemiology of tuberculosis in multi-host wildlife systems: implications for black (Diceros bicornis) and white (Ceratotherium simum) rhinoceros. Frontiers in Veterinary Science, 7, p.887.
Duffy, R. 2014. Waging a war to save biodiversity: the rise of militarized conservation. International Affairs, 90(4), pp.819-834.
Eikelboom, J.A.J. & Prins, H.H.T. 2024. Poaching pressure on African rhinos is still at an all-time high. Science Advances 10, eadl1482.
Emslie, R. 2020. Diceros bicornis ssp. minor. The IUCN Red List of Threatened Species 2020: e.T39321A152729173. https://dx.doi.org/10.2305/IUCN.UK.2020-1.RLTS.T39321A152729173.en
Emslie, R. H., Adcock, K. & Hansen, H. B. 1995. Fine tuning rhino management group age class system. Rhino Management Group Report, Port Elizabeth, South Africa.
Emslie, R.H., Amin, R. & Kock, R. 2009. Guidelines for the in-situ re-introduction and translocation of African and Asian rhinoceros. http://www.iucn.org/dbtw-wpd/html/SSC-OP-039/cover.html
Emslie, R. & Brooks, M. (compilers). 1999. African Rhino: Status Survey and Action Plan. IUCN, Gland, Switzerland.
Emslie, R.H., Milliken, T., Talukdar, B., Ellis, S., Adcock, K. & Knight, M.H. 2016. African and Asian Rhinoceroses – Status, Conservation and Trade. A report from the IUCN SSC African and Asian Rhino Specialist Groups and TRAFFIC to the CITES Secretariat. https://cites.org/sites/default/files/eng/cop/17/WorkingDocs/E-CoP17-68-A5.pdf
Everatt, K.T., Andresen, L., Ripple, W.J. & Kerley, G. 2016. Rhino poaching may cause atypical trophic cascades. Frontiers in Ecology and the Environment 14: 65-67.
Ferreira, S. M., ’t Sas-Rolfes, M., Balfour, D., et al. 2024a. Risky conclusions regarding shrinking rhino horns. People and Nature, 6, 1015–1018. https://doi.org/10.1002/pan3.10552
Ferreira, S.M., ‘t Sas-Rolfe, M., Dublin, H., et al. 2024b. Restrained global recovery of African rhinos. Oryx. Submitted. Draft available from the AfRSG.
Ferreira, S.M., Bissett, C., Cowell, C.R., et al. 2017. The status of rhinoceroses in South African national parks. Koedoe, 59(1), pp.1-11.
Ferreira, S.M., Crowhurst, E.T., Greaver, C. & Simms, C. 2024c. Resizing Kruger National Park: Trends in numbers of rhinoceroses within priority zones, Koedoe 66(1), a1802. https://doi.org/10.4102/koedoe.v66i1.1802
Ferreira, S.M. & Dziba, L. 2021. Where are rhinos safest? South African Journal of Science, 117(9-10), pp.1-3.
Ferreira, S.M. & Dziba, L. 2023. Rhinoceros accounting in Kruger National Park, South Africa. Journal for Nature Conservation, 72, p.126359.
Ferreira, S.M., Ellis, S., Burgess, G., et al. 2022. The African and Asian Rhinoceroses – Status, Conservation and Trade. CoP19 Doc. 75 (Rev. 1), CITES Secretariat. https://cites.org/sites/default/files/documents/COP/19/resolution/E-Res-09-14-R19.pdf
Ferreira, S.M. & Greaver, C. 2016. Re-introduction success of black rhinoceros in Marakele National Park. African Journal of Wildlife Research, 46(2), pp.135-138.
Ferreira, S.M., Greaver, C.C. & Knight, M.H. 2011. Assessing the population performance of the black rhinoceros in Kruger National Park. South African Journal of Wildlife Research 41: 192– 204.
Ferreira, S.M., Greaver, C., Knight, G.A., et al. 2015. Disruption of rhino demography by poachers may lead to population declines in Kruger National Park, South Africa. PLOS ONE 10: e0127783.
Ferreira, S.M., Greaver, C., Nhleko, Z. & Simms, C., 2018. Realization of poaching effects on rhinoceroses in Kruger National Park, South Africa. African Journal of Wildlife Research, 48(1), pp.1-7.
Ferreira, S.M., Greaver, C., Simms, C. & Dziba, L. 2021. The impact of COVID-19 government responses on rhinoceroses in Kruger National Park. African Journal of Wildlife Research, 51(1), pp.100-110.
Ferreira, S.M., Goodman, P., Balfour, P., Vigne, L. Knight, M. & Mosweu, K. 2024d. Conservation impacts and the future of the black rhinoceros (Diceros bicornis). African Journal of Wildlife Research, 54, pp.81-91.
Ferreira, S.M., le Roex, N. & Greaver, C. 2019. Species-specific drought impacts on black and white rhinoceroses. PLoS One, 14(1), p.e0209678.
Ferreira, S.M. & Okita-Ouma B. 2012. A proposed framework for short-, medium-and long-term responses by range and consumer States to curb poaching for African rhino horn. Pachyderm 51: 52-59.
Ferreira, S.M., Pfab, M. & Knight, M. 2014. Management strategies to curb rhino poaching: Alternative options using a cost-benefit approach. South African Journal of Science 110: 1-8.
Fischer-Tenhagen, C., Hamblin, C., Quandt, S. & Frölich, K. 2000. Serosurvey for selected infectious disease agents in free-ranging black and white rhinoceros in Africa. Journal of Wildlife Diseases, 36(2), pp.316-323.
Geldenhuys, K. 2016. Finding the relevant legislation to prosecute organised criminal groups. Servamus Community-based Safety and Security Magazine, 109(4), pp.20-23.
Greaver, C., Ferreira. S. & Slotow, R. 2014. Density-dependent regulation of the critically endangered black rhinoceros population in Ithala Game Reserve, South Africa. Austral Ecology 39: 437–447.
Haas, T.C. & Ferreira, S.M. 2015. Federated databases and actionable intelligence: using social network analysis to disrupt transnational wildlife trafficking criminal networks. Security Informatics 4: 1-14.
Haas, T.C. & Ferreira, S.M. 2016. Combating rhino horn trafficking: The need to disrupt criminal networks. PLoS One, 11(11), p.e0167040.
Haas, T.C. & Ferreira, S.M. 2018. Optimal patrol routes: interdicting and pursuing rhino poachers. Police Practice and research, 19(1), pp.61-82.
Hansen, P.E. 1989. Leslie matrix models. Mathematical Population Studies, 2(1), pp.37-67.
Hanski, I. 1999. Connectivity, habitat continuity, and metapopulations in dynamic landscapes. Oikos 87: 209-219.
Harley, E.H., Baumgarten, I., Cunningham, J. and O’Ryan, C. 2005. Genetic variation and population structure in remnant populations of black rhinoceros, Diceros bicornis, in Africa. Molecular Ecology 14: 2981–2990.
Harper, C., Ludwig, A., Clarke, A., et al. 2018. Robust forensic matching of confiscated horns to individual poached African rhinoceros. Current Biology, 28(1), pp.R1-R16.
Hitchins, P.M. & Anderson, J.L. 1983. Reproduction, population characteristics and management of the black rhinoceros Diceros bicornis minor in the Hluhluwe/Corridor/Umfolozi Game Reserve Complex. South African Journal of Wildlife Research 13: 78–85.
Hrabar, H. & du Toit, J.T. 2005. Dynamics of a protected black rhino (Diceros bicornis) population: Pilanesberg National Park, South Africa. Animal Conservation 8: 259–267.
Humphreys, J. & Smith, M.L.R. 2014. The “rhinofication” of South African security. International Affairs 90: 795-818.
Hutu, I., Oldenbroek, K. & van der Waaij, L. 2020. Chapter II. 5. Genetic relationships and inbreeding. In Animal breeding and husbandry. USAB, Agroprint, Timisoara.
IUCN Standards and Petitions Subcommittee. 2024. Guidelines for Using the IUCN Red List Categories and Criteria. Version 16. https://www.iucnredlist.org/resources/redlistguidelines.
Jooste, J. & Ferreira, S.M. 2018. An appraisal of green militarisation to protect rhinoceroses in Kruger National Park. African Studies Quarterly 18(1): 49–59.
Kanitz, R., Guillot, E.G., Antoniazza, S., Neuenschwander, S. & Goudet, J. 2018. Complex genetic patterns in human arise from a simple range-expansion model over continental landmasses. PLoS ONE 13(2): e0192460. https://doi.org/10.1371/journal.pone.0192460
Kim, S. 2021. “Stop killing OUR rhinos!”: Transformation of khaki-clad colonialism into the collective rhino keeper identity. International Area Studies Review 25(2), pp.147-164.
Knight MH, Balfour D, Emslie RH. 2011. Biodiversity management plan for the black rhinoceros (Diceros bicornis) in South Africa: 2011-2020. Department of Environmental Affairs, South Africa.
Kuiper, T. Haussmann, S., Whitfield, S., et al. 2024. What works to curb rhino poaching and how much does it cost? Science. Submitted.
Lagrot, I., Lagrot, J.F. and Bour, P., 2007. Probable extinction of the western black rhino, Diceros bicornis longipes: 2006 survey in northern Cameroon. Pachyderm, 43, pp.19-28.
Law, P.R., Fike, B. & Lent, P.C. 2015. Dynamics of an expanding black rhinoceros (Diceros bicornis minor) population. European Journal of Wildlife Research 61: 601–609.
le Roex, N., Dreyer, C. & Ferreira, S.M. 2020. Poaching creates ecological traps within an iconic protected area. Animal Conservation, 23(3), pp.250-259.
le Roex, N., Dreyer, C., Viljoen, P., et al. 2019. Seasonal space-use and resource limitation in free-ranging black rhino. Mammalian biology, 99(1), pp.81-87.
le Roex, N. & Ferreira, S.M. 2020. Age structure changes indicate direct and indirect population impacts in illegally harvested black rhino. PLoS One, 15(7), p.e0236790.
Lindsey, P.A. & Taylor, A. 2011. A study on the dehorning of African rhinoceroses as a tool to reduce the risk of poaching. Department of Environmental Affairs, South Africa.
MacKenzie, J.M. 2017. Hunting and African societies. In The Empire of Nature (pp. 54-84). Manchester University Press.
Masel, J. 2011. Genetic drift. Current Biology, 21(20), pp.R837-R838.
Miller, M., Michel, A., Van Helden, P. & Buss, P. 2017. Tuberculosis in rhinoceros: an underrecognized threat? Transboundary and Emerging Diseases, 64(4), pp.1071-1078.
Minnaar, A. & Herbig, F. 2018. The impact of conservation crime on the South African rural economy: A case study of rhino poaching. Acta Criminologica, 31(4), pp.147-168.
Moodley, Y., Russo, I.R.M., Dalton, D.L., et al., 2017. Extinctions, genetic erosion and conservation options for the black rhinoceros (Diceros bicornis). Scientific Reports, 7(1), p.41417.
Nadal, A. & Aguayo, F. 2014. Leonardo’s sailors: A review of the economic analysis of wildlife trade. LCSV Working Paper Series No. 6. University of Manchester, UK.
Nhleko, Z.N., Ahrens, R., Ferreira, S.M. & McCleery, R.A. 2022. Poaching is directly and indirectly driving the decline of South Africa’s large population of white rhinos. Animal Conservation, 25(2), pp.151-163.
Olivier, P.I., van Aarde, R.J. & Ferreira, S.M. 2009. Support for a metapopulation structure among mammals. Mamm Rev, 39: 178–192.
Olmedo, A. 2015. Evaluating behaviour change interventions: A case study in Vietnam. Imperial College London.
Plotz, R.D., Grecian, W.J., Kerley, G.I. & Linklater, W.L. 2016. Standardising home range studies for improved management of the critically endangered black rhinoceros. PLoS One, 11(3), p.e0150571.
Rachlow, J.L. & Berger, J. 1998. Reproduction and population density: trade-offs for the conservation of rhinos in situ. Animal Conservation 1: 101–106.
Rademeyer, J. 2023. Landscape of fear: Crime, corruption and murder in greater Kruger, ENACT Africa.
Redford, K.H., Amato, G., Baillie, J., et al. 2011. What does it mean to successfully conserve a (vertebrate) species? BioScience, 61(1), pp.39-48.
Sánchez-Barreiro, F., De Cahsan, B., Westbury, M.V., et al., 2023. Historic sampling of a vanishing beast: population structure and diversity in the black rhinoceros. Molecular biology and evolution, 40(9), p.msad180.
Sherriffs, P. 2006. Black rhino range expansion project. Pachyderm, 41, pp.105-106.
Sinek, S., 2019. The infinite game. Penguin.
Skinner, J.D. & Chimimba, C.T. 2005. The mammals of the southern African sub-region. Cambridge University Press.
Stanbridge, D., O’Riain, M.J., Dreyer, C. & le Roex, N. 2023. Genetic restoration of black rhinoceroses in South Africa: conservation implications. Conserv Genet 24, 99–107. https://doi.org/10.1007/s10592-022-01486-y
Steffen, P.J.C. 2003. How long have we been in the Anthropocene era? Climatic Change, 61(3): 251.
Steinhart, E.I. 1989. Hunters, poachers and gamekeepers: towards a social history of hunting in colonial Kenya. The Journal of African History, 30(2), pp.247-264.
Steiner, F.R., 2012. The living landscape: an ecological approach to landscape planning. Island Press.
Taylor, A., Brebner, K., Coetzee, R., et al. 2014. The viability of legalising trade in rhino horn in South Africa. Department of Environmental Affairs (DEA), Pretoria, South Africa.
Thomas R. 2010. Surge in rhinoceros poaching in South Africa. TRAFFIC Bulletin 23: 2.
Vu, H.N.D. & Nielsen, M.R. 2021. Evidence or delusion: A critique of contemporary rhino horn demand reduction strategies. Human Dimensions of Wildlife, 26(4), pp.390-400.
Vu, H.N.D., Nielsen, M.R. & Jacobsen, J.B. 2020. Reference group influences and campaign exposure effects on rhino horn demand: Qualitative insights from Vietnam. People and Nature, 2(4), pp.923-939.
Vu, H.N.D., Nielsen, M.R. & Jacobsen, J.B. 2022. Conserving rhinos by legal trade: Insights from a choice experiment with rhino horn consumers. Ecological Economics, 193, p.107287.
Watson, J.E., Jones, K.R., Fuller, R.A., et al. 2016. Persistent disparities between recent rates of habitat conversion and protection and implications for future global conservation targets. Conservation Letters, 9(6), pp.413-421.
WJC. 2022. Rhino horn trafficking as a form of transnational organized crime. Wildlife Justice Commission. https://wildlifejustice.org/wp-content/uploads/2022/11/Synopsis-Rhino-Horn-Trafficking-Report-2022-Pages-5.pdf
Zimmermann, D.E., Penzhorn, B.L., Vorster, I., et al. 2021. Babesia bicornis, Theileria bicornis and Theileria equi in metapopulations of two black rhinoceros (Diceros bicornis) sub-species in South Africa. Ticks and Tick-borne Diseases, 12(2), p.101635.