

African Shaggy Rat
Dasymys incomtus

2025 Red list status
Vulnerable
Regional Population Trend
Declining
Change compared
to 2016
Uplisted
Overview
Dasymys incomtus – (Sundevall, 1847)
ANIMALIA – CHORDATA – MAMMALIA – RODENTIA – MURIDAE – Dasymys – incomtus
Common Names: African Shaggy Rat, African Marsh Rat, Common Dasymys (English), Waterrot (Afrikaans)
Synonyms: None.
Taxonomic Note:
There are at least 14 Dasymys species recognised based on morphological evidence (Monadjem et al. 2015). Mullin et al. (2005) provided a biogeographical framework for 11 of these morphological species, showing that many of the range-restricted endemics were associated with endemic hotspots for other species of mammals. Of relevance to the assessment region, two species have been split from D. incomtus: D. capensis has been elevated to full species status based on cranial morphology and its isolated distribution in the Cape region (Mullin et al. 2004). Similarly, D. robertsii (from northern South Africa) was previously known as D. incomtus but is chromosomally, genetically and morphologically distinct (Mullin et al. 2002, 2004). Finally, D. incomtus now refers only to the population restricted to eastern South Africa (from where the type locality originates), leaving the populations outside of this region without a name and are referred to as D. cf incomtus for now (Monadjem et al. 2015). This genus is in urgent need of a continent-wide review.
Red List Status: Vulnerable – VU C2a(i) (IUCN version 3.1)
Assessment Information
Assessors: Taylor, P.1
Reviewers: Oosthuizen, M.2
Contributors: Smith, C.3, Patel, T.3 & da Silva, J.M.4
Institutions: 1University of the Free State,2University of Pretoria, 3Endangered Wildlife Trust, 4South Africa National Biodiversity Institute.
Previous Assessors: Pillay, N., Taylor, P., Jewitt, D., Pence, G. & Baxter, R.
Previous Reviewer: Child, M.F.
Previous Contributors: Roxburgh, L., Avenant, N., Avery, M., MacFadyen, D., Monadjem, A., Palmer, G. & Wilson, B.
Assessment Rationale
African Shaggy Rats are dependent on intact rivers and wetland ecosystems, as they have not been found in artificial or degraded wetlands and are thus patchily distributed within the assessment region. Furthermore, they are rare relative to Otomys spp., occurring at low densities with low reproductive rates within fragmented subpopulations. Although previously assessed as one species (D. incomtus), new data reveal three species within the assessment region: D. capensis endemic to the Cape region, D. incomtus probably endemic to the eastern areas of the assessment region, and D. robertsii occurring throughout northern South Africa and Zimbabwe. The extent of occurrence for D. incomtus is estimated to be far greater than 10,000 km2. The area of occupancy, calculated by summing the amount of remaining natural vegetation around wetlands within the species’ range, is estimated to be between 2,382–13,823 km2. These values, however, do not account for degraded habitats and include potentially unoccupied patches (resulting from the poor dispersal ability of the species). Thus, we take a precautionary purview to this assessment by using the lower bound of the occupancy values.
Wetlands are continuing to be lost with agricultural and human settlement expansion, which in turn increases wetland degradation from overgrazing, water abstraction, pollution and invasive alien plant sprawl. For example, between 2005 and 2011 in KwaZulu-Natal Province, 7.6% (7,217 km2) of natural habitat was lost (1.3% per annum), which equates to a 13% loss of habitat over ten years (Drover et al. 2012). The degradation of natural habitats including wetlands in KwaZulu-Natal is continuing. Overall terrestrial habitat loss is 7% over the whole RSA, but the Indian Ocean Coastal Belt, a narrow biome (~20 km wide) stretching from the Eastern Cape through KwaZulu-Natal into Mozambique, stands out in terms of high overall habitat loss and rate of loss. Most severe loss has occurred over the period of 2014-2018 (Skowno et al. 2021). Given the restricted range, habitat fragmentation and ongoing loss of suitable wetland habitat we list D. incomtus as Vulnerable C2a(i) as density estimates suggested a population size of < 10,000 mature individuals. Given the rapid pace of land transformation in KwaZulu-Natal compounded by climate change and the rarity of the species based on very low trap capture success, we consider this population estimate to be highly optimistic. We consider these genuine changes, as 32.8% of wetlands nationally have been lost between 1990 and 2013/14 (although this includes many wetlands that are simply temporarily dry due to the wetter conditions in 1990). This species should be reassessed once density estimates in suitable habitat are available. Key interventions for these species include conserving and restoring strips of natural vegetation around wetlands and riverside and extending protected wetland habitat area and connectivity through biodiversity stewardship schemes.
Regional population effects: Although we assume that D. incomtus is endemic to the eastern region of the assessment region, future molecular work is needed to affirm this.
Reasons for Change
Reason(s) for Change in Red List Category from the Previous Assessment: The ongoing loss of suitable wetland habitat and density estimates resulted in a genuine uplisting of the species.
Red List Index
Red List Index: Uplisted
Recommended Citation: Taylor P. 2025. A conservation assessment of Dasymys incomtus. In Patel T, Smith C, Roxburgh L, da Silva JM & Raimondo D, editors. The Red List of Mammals of South Africa, Eswatini and Lesotho. South African National Biodiversity Institute and Endangered Wildlife Trust, South Africa.
Regional Distribution and occurrence
Geographic Range
These species are associated with rivers and wetlands within the northern and southern African savannas from Senegal in the west to Ethiopia in the east and south to the Western Cape Province of South Africa (Monadjem et al. 2015). The type specimen for the genus was collected in Durban. Mullin et al. (2002, 2005) provided molecular and biogeographical evidence for the existence of D. incomtus in the KwaZulu-Natal Province region, D. robertsii in the lowveld and northern provinces of South Africa, and D. capensis in the Western Cape Province. No Dasymys species has been recorded from Lesotho (Lynch 1994).
The African Shaggy Rat, D. incomtus, was previously thought to range widely across Africa, including across South Africa (Friedmann and Daly 2004), but recent genetic and morphometric analyses show that it is endemic to eastern South Africa and Eswatini (Monadjem 1998; Mullin et al. 2002, 2004). Based on morphological similarity, the species may also occur in southeast Zimbabwe in the eastern Highlands (Mt. Selinda and Mazoe) (Mullin et al. 2005), but this has not been confirmed by chromosomal or molecular analysis. If it is the same species, there is a disjunct distribution between the populations of the assessment region and Zimbabwe. Its full distribution still needs to be confirmed by sampling more localities in Zimbabwe (Mullin 2003). It is associated with Tongaland-Pondaland coastal mosaic vegetation. The Drakensberg Mountain range largely separates D. incomtus and D. robertsii but the two species are connected via a possible dispersal route through Mpumalanga Province on the eastern side of the Drakensberg and thus it is not clear why there is such a strong distinction between D. incomtus and D. robertsii (Mullin et al. 2005). We suspect this species is range-limited within KwaZulu-Natal Province due to past and ongoing wetland modification, destruction and deterioration (Driver et al. 2012).
The extent of occurrence (EOO) is 104,281 km2 and area of occupancy (AOO) is estimated between 2,382–13,823 km2. While the EOO was calculated using all available records, the AOO was systematically estimated by buffering wetlands within the EOO by both 500 m (strip width used to assess habitat condition around wetlands in the National Biodiversity Assessment, as it provides a good proxy for wetland condition; Driver et al. 2012) and 32 m (minimum buffer zone of no development around waterbodies, as set in the National Environmental Management Act, Activity 9 and 11 Listing 1 of Government Notice R544 and Activity 16 Listing 3 of Government Notice R546 of 2010), using the wetland layer created by the National Biodiversity Assessment (Nel et al. 2011). The amount of remaining natural vegetation was then calculated using a 2013–14 national land-cover dataset (GeoTerraImage 2015a). However, these data do not include degraded habitat and thus, in reality, AOO is likely to be smaller.
Elevation / Depth / Depth Zones
Elevation Lower Limit (in metres above sea level): (Not specified)
Elevation Upper Limit (in metres above sea level): (Not specified)
Depth Lower Limit (in metres below sea level): (Not specified)
Depth Upper Limit (in metres below sea level): (Not specified)
Depth Zone: (Not specified)
Map
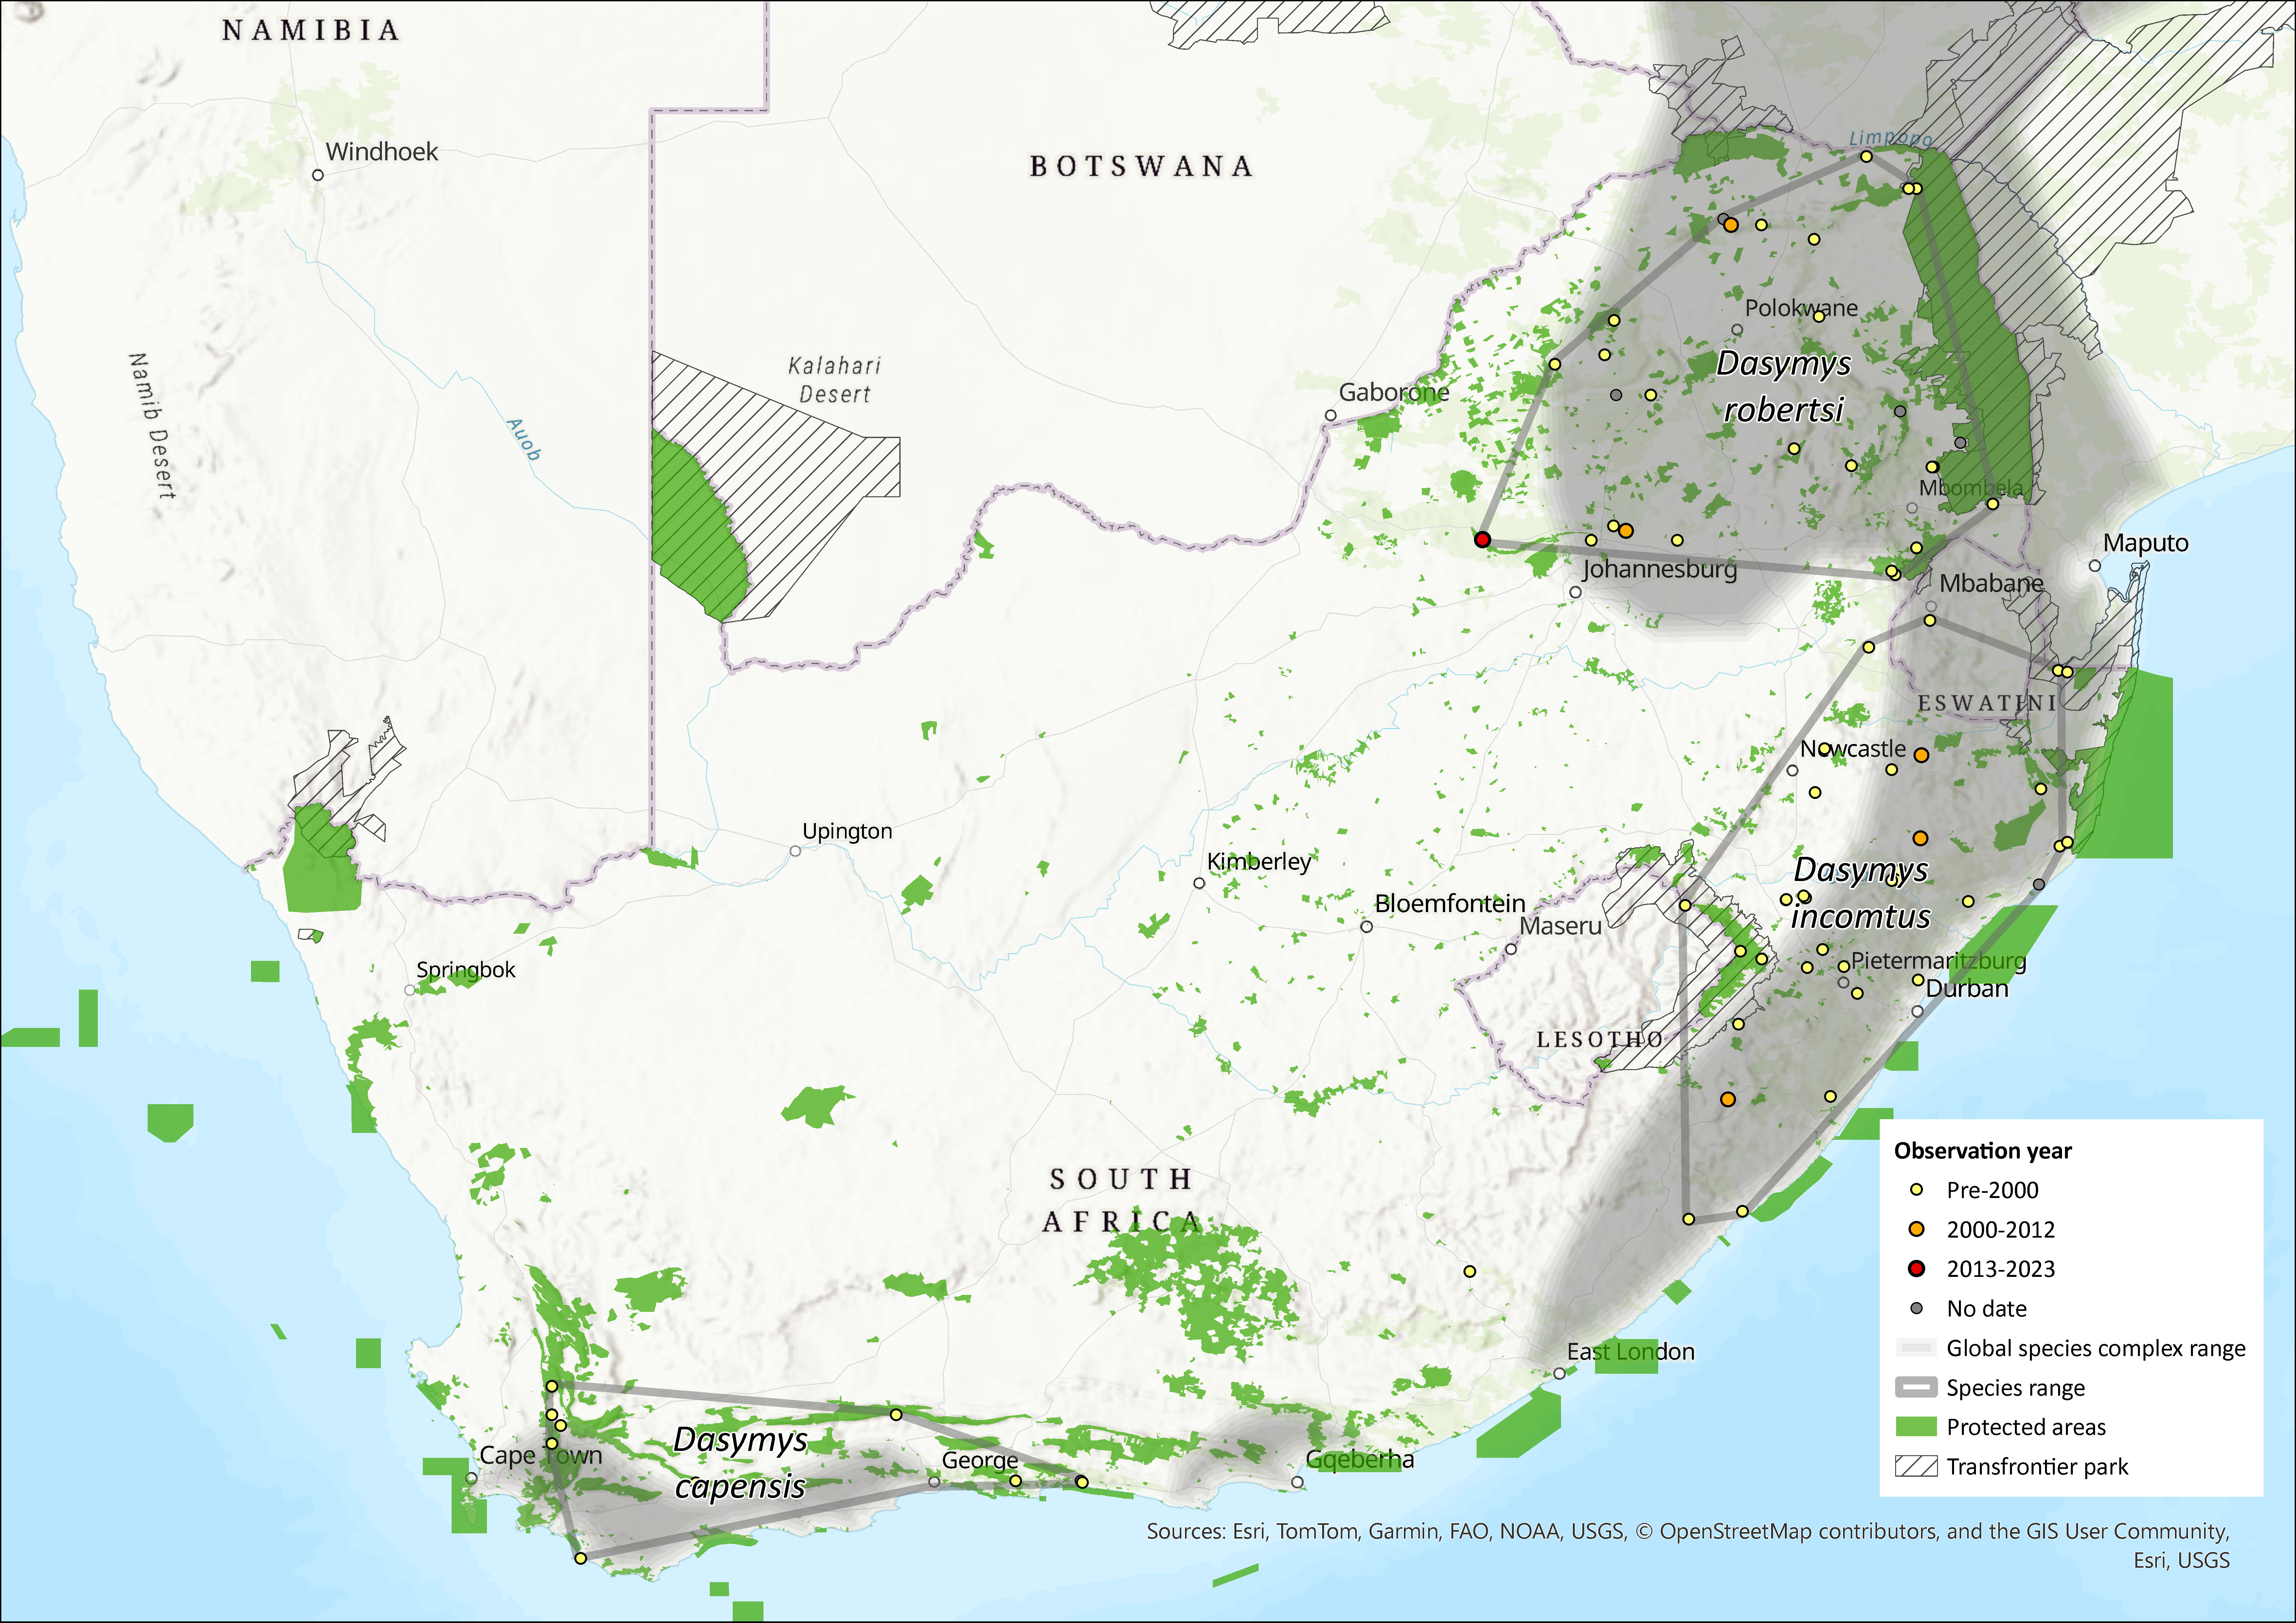
Figure 1. Distribution records for African Shaggy Rat (Dasymys incomtus) within the assessment region (South Africa, Eswatini and Lesotho). Note that distribution data is obtained from multiple sources and records have not all been individually verified.
Biogeographic Realms
Biogeographic Realm: Afrotropical
Occurrence
Countries of Occurrence within southern Africa
| Country | Presence | Origin | Formerly Bred | Seasonality |
| Eswatini | Extant | Native | – | – |
| Mozambique | Uncertain | Native | – | – |
| South Africa | Extant | Native | – | – |
| Zimbabwe | Uncertain | Native | – | – |
Large Marine Ecosystems (LME) Occurrence
Large Marine Ecosystems: (Not specified)
FAO Area Occurrence
FAO Marine Areas: (Not specified)
Climate change
Shaggy Rats are grassy wetland specialists, often sharing habitats with Vlei Rats. They are dependent on marshy soils and standing water to construct their nests. Direct anthropogenic threats such as reduced run-off in rivers due to water abstraction, afforestation and drainage of wetlands are compounded by shrub encroachment and aridification of grasslands caused by climate change (Taylor et al. 2016).
Population information
The abundances and population sizes of these species is unknown. They are rare and exist at low densities. For example, at Karkloof Forest in KwaZulu-Natal Province, where Otomys and Dasymys co-occur, sustained collecting in suitable habitats by K. Willan over a number of years resulted in 130 Otomys and only one Dasymys (P. J. Taylor, unpub. data based on records in the Durban Natural Science Museum). As a wetland specialist that rarely emerges from the wetlands, it is trap-shy and thus difficult to monitor. Compared to other African rodents of similar size, D. incomtus has low reproductive output and delayed postnatal development, which may compromise its ability to cope with continued habitat loss (Pillay 2003).
Population Information
Population trend: Declining, based on ongoing habitat loss and degradation.
Continuing decline in mature individuals? Unknown
Extreme fluctuations in the number of subpopulations: (Not specified)
Continuing decline in number of subpopulations: (Not specified)
All individuals in one subpopulation: (Not specified)
Number of mature individuals in population: Unknown
Number of mature individuals in largest subpopulation: Unknown
Number of Subpopulations: Unknown
Severely fragmented: Yes. Their habitat is fragmented, and they are suspected to be poor dispersers.
Quantitative Analysis
Probability of extinction in the wild within 3 generations or 10 years, whichever is longer, maximum 100 years: (Not specified)
Probability of extinction in the wild within 5 generations or 20 years, whichever is longer, maximum 100 years: (Not specified)
Probability of extinction in the wild within 100 years: (Not specified)
Population genetics
Fixed chromosomal and allozyme allelic characters distinguish D. robertsii from Mpumalanga and Limpopo from D. incomtus sensu stricto from KwaZulu-Natal. Within D. incomtus, populations from southern and northern KwaZulu-Natal (having the same chromosomal configuration) are partly distinct in allozymes. Allozyme divergence could be explained by geographic distance consistent with the isolation by distance model (Mullin et al. 2002). High fixation indices (mean Fst 0.42) and a high proportion of private alleles in the species-group suggest a highly subdivided metapopulation structure consistent with a fragmented distribution of suitable wetland habitats, with limited current gene flow between them. Suitable habitats likely expanded and contracted with cyclical wet-dry cycles in the Holocene, providing periods of past gene flow followed by cessation of gene flow (Mullin et al. 2002).
Based on this information, the number of genetic populations (subpopulations) are considered to be 1 (a single metapopulation), and from this we can quantify the Convention on Biological Diversity’s Global Biodiversity Framework’s complementary genetic indicator – proportion of populations maintained (PM), which would receive a value of 1.0 (1/1 populations remaining). While it is thought that D. incomtus dispersal may be possible through corridors or riverine vegetation within the Greater Limpopo Transfrontier Park and Mapungubwe Transfrontier Conservation Area, given the fragmentation of wetland habitats, and the assumed poor dispersal abilities of the species, there might be genetically distinct, isolated subpopulations. Despite this, no subpopulations are thought to have gone extinct, therefore, the indicator value would not change should genetic structure (not following an isolation by distance pattern) be found.
A rough population size estimate of < 10 000 individuals has been attributed to this species; although it is likely an overestimate. Even if the population size is halved, we can infer the effective population size (Ne) using a Ne/Nc conversion ratio of 0.1-0.3. This amounts to an Ne between 500-3 000 individuals. Based on this broad estimate, the GBF’s headline indicator – proportion of species with an Ne greater than 500 – is 1.0 (1/1 populations with Ne > 500). Given this is not based on actual census or genetic data, it is highly recommended a population genetic study be undertaken to directly estimate contemporary Ne for the species and to verify the population genetic structure. Given the rarity of this species, conventional sampling may be difficult, so alternative methods such as environmental DNA can be investigated.
Habitats and ecology
These species have been recorded from a wide variety of habitats, including forest and savannah, swampland and grasslands, but they rely on intact wetlands in these areas. They have not been recorded from agricultural landscapes or dam areas. They occur specifically in reed beds and among semi-aquatic grasses in wetlands or swampy areas or along rivers and streams, as well as in grassy areas close to water wherein they co-occur with Otomys spp. (Skinner and Chimimba 2005). African Shaggy Rats construct complex, intricately woven nests in holes along the banks of rivers and ponds (Pillay 2003). Nests extend into water and might serve as a bolt hole during attack from predators. Sub- and above-surface runways extend from the nest cavities and would serve as travel routes. These rodents are opportunistic omnivores, feeding predominantly on the succulent stems and fruiting heads of semi-aquatic grasses (Skinner and Chimimba 2005), supplementing their diets with insects, especially during reproduction (Pillay 2003). They are good swimmers, adapted to living in very marshy habitats where they build runways and nests in dense ground cover (Monadjem et al. 2015). Based on a captive study, the gestation period is 29 days and litter size varies from two to five (Pillay 2003, Skinner and Chimimba 2005). Maximum reproductive output during one artificial breeding season was 18 young.
Young are altricial and nipple-cling, and reproductive output is low compared to other African rodents (Pillay 2003). In the assessment region, they occur at altitudes from sea level to 1,500 m asl in the Drakensberg Mountains (Skinner and Chimimba 2005).
Ecosystem and cultural services: Potential to become flagship wetland species for biodiversity stewardship schemes.
IUCN Habitats Classification Scheme
| Habitat | Season | Suitability | Major Importance? |
| 1.5. Forest -> Forest – Subtropical/Tropical Dry | – | Suitable | – |
| 1.6. Forest -> Forest – Subtropical/Tropical Moist Lowland | – | Suitable | – |
| 1.8. Forest -> Forest – Subtropical/Tropical Swamp | – | Unknown | – |
| 2.1. Savanna -> Savanna – Dry | – | Suitable | – |
| 2.2. Savanna -> Savanna – Moist | – | Suitable | – |
| 3.5. Shrubland -> Shrubland – Subtropical/Tropical Dry | – | Suitable | – |
| 3.6. Shrubland -> Shrubland – Subtropical/Tropical Moist | – | Suitable | – |
| 4.4. Grassland -> Grassland – Temperate | – | Suitable | – |
| 4.5. Grassland -> Grassland – Subtropical/Tropical Dry | – | Unknown | – |
| 4.6. Grassland -> Grassland – Subtropical/Tropical Seasonally Wet/Flooded | – | Suitable | – |
| 5.4. Wetlands (inland) -> Wetlands (inland) – Bogs, Marshes, Swamps, Fens, Peatlands | – | Suitable | – |
Life History
Generation Length: (Not specified)
Age at Maturity: Female or unspecified: (Not specified)
Age at Maturity: Male: (Not specified)
Size at Maturity (in cms): Female: (Not specified)
Size at Maturity (in cms): Male: (Not specified)
Longevity: (Not specified)
Average Reproductive Age: (Not specified)
Maximum Size (in cms): (Not specified)
Size at Birth (in cms): (Not specified)
Gestation Time: 29 days
Reproductive Periodicity: seasonal – wet season
Average Annual Fecundity or Litter Size: 2-5 pups
Natural Mortality: (Not specified)
Does the species lay eggs? no
Does the species give birth to live young: yes
Does the species exhibit parthenogenesis: no
Does the species have a free-living larval stage? no
Does the species require water for breeding? no
Movement Patterns
Movement Patterns: (Not specified)
Congregatory: (Not specified)
Systems
System: Terrestrial, Freshwater (=Inland waters)
General Use and Trade Information
This species is not known to be traded or utilised in any form.
Local Livelihood: (Not specified)
National Commercial Value: (Not specified)
International Commercial Value: (Not specified)
End Use: (Not specified)
Is there harvest from captive/cultivated sources of this species? (Not specified)
Harvest Trend Comments: (Not specified)
Threats
There are several major threats to this species, which revolve around habitat loss and degradation. Wetlands are the country’s most threatened ecosystem, with 65% of wetland ecosystem types threatened (48% of all wetland types Critically Endangered, 12% Endangered and 5% Vulnerable) because they are highly productive and hence become transformed for agriculture (Driver et al. 2012, Skowno et al. 2020). The 1990–2013/14 South African National Land-Cover change report found a 32.78% decline in wetlands, nationally, during the study period (GeoTerraImage 2015a). However, this is partially confounded by 1990 being generally wetter than 2013/14 and so many wetlands in the drier western regions may not be lost, but just temporarily dry. Habitat loss due to land transformation in the surrounding matrix further isolates wetlands from one another and exacerbates the degradation of individual wetlands. For example, sugarcane plantations are often planted right up to wetlands edges, not respecting the appropriate buffer (D. Jewitt pers. obs. 2015). Water abstraction or filling in of wetlands from human settlement and industrial expansion also leads to habitat loss. Compounding this is wetland degradation from overgrazing rank grasses surrounding wetlands, which leads to the loss of ground cover and decreases small mammal diversity and abundance (Bowland and Perrin 1989, 1993). Similarly, suppression of natural ecosystem processes, such as fire, can also lead to habitat degradation through bush encroachment or loss of plant diversity through alien invasive species, and is suspected to be increasing with human settlement expansion. Overall, 45% of our remaining wetland area exists in a heavily modified condition, due primarily to onsite modification from crop cultivation, coal mining, urban development, dam construction, and overgrazing (and thus erosion) and off-site modifications from disruptions to flow regime and deterioration of water quality (Driver et al. 2012). For example, the number of dams in KwaZulu-Natal Province has increased from approximately 14,455 in 2005 to over 20,980 in 2011 (Jewitt et al. 2015), which represents a 45% increase in the number of dams and a 26% increase in the extent of dams. This has obvious impacts on flow levels causing drying out of hydromorphic grasslands during dry periods. These trends of natural habitat transformation observed in the 2012 assessment were also shown to continue at an accelerating pace in the period from 1990 to 2018 (Skowno et al. 2019, 2020).
Conservation
In KwaZulu-Natal, D. incomtus occurs in Ndumo Game Reserve, Karkloof Nature Reserve and the Maloti Drakensberg Park at least. There are two important types of intervention that are a priority for this species:
- Conserve and create wetland clusters and corridors. Biodiversity stewardship schemes should be promoted if landowners possess wetlands close to core protected areas or remaining habitat patches, and the effects on small mammal subpopulations should be monitored. Protecting such habitats may create dispersal corridors between patches that will enable adaptation to climate change.
- Conserve or restore riparian vegetation around wetlands. Retaining ground cover and rank vegetation is the most important management tool to increase small mammal diversity and abundance around wetlands. This can be achieved through lowering grazing pressure (Bowland and Perrin 1989), or by maintaining a buffer strip of natural vegetation around wetlands (Driver et al. 2012). Small mammal diversity and abundance is also higher in more complex or heterogeneous landscapes, where periodic burning is an important tool to achieve these (Bowland and Perrin 1993). Removing alien vegetation from watersheds, watercourses and wetlands is also an important intervention to improve flow and water quality, and thus habitat quality. Education and awareness campaigns should be employed to teach landowners and local communities about the importance of conserving wetlands.
Recommendations for land managers and practitioners:
- Working for Water managers should continue to work with private landowners in key wetland areas to remove alien vegetation.
- Landowners and communities should be incentivised to stock livestock or wildlife at ecological carrying capacity and to maintain a buffer of natural vegetation around wetlands.
- Enforce regulations on developments that potentially impact on the habitat integrity of grasslands and wetlands.
- Publicise these species for conservancies as symbols of wetland conservation and thus biodiversity stewardship agreements.
Research priorities:
- Field surveys to more accurately delineate geographic distribution, especially in the Eastern Cape Province, and investigating particularly whether these species occur within artificial waterbodies, agricultural landscapes and urban/rural gardens.
- Similarly, density estimates need to be produced. Dasmys incomtus should be re-assessed once such data become available.
- Estimating current and future rates of wetlands and/or natural habitat loss within the species’ ranges.
Encouraged citizen actions:
- Private landowners should continue to work with Working for Water to conserve wetlands and improve ecosystem functioning.
- Similarly, citizen scientists can collect owl pellets for deposit at natural history museums and help experts to identify small mammal species.
Bibliography
Avery DM, Avery G, Palmer NG. 2005. Micromammalian distribution and abundance in the Western Cape Province, South Africa, as evidenced by Barn owls Tyto alba, (Scopoli). Journal of Natural History 39: 2047–2071.
Bowland AE, Perrin MR. 1989. The effect of overgrazing on the small mammals in Umfolozi Game Reserve. Mammalian Biology 54: 251–260.
Bowland JM, Perrin MR. 1993. Wetlands as reservoirs of smallmammal populations in the Natal Drakensberg. South African Journal of Wildlife Research 23: 39–43.
Davis DH. 1962. Distribution patterns of southern African Muridae, with notes on some of their fossil antecedents. Annals of the Cape Province Museum of Natural History 2: 56–76.
Desmet PG, Holness S, Skowno A, Egan VT. 2013. Limpopo Conservation Plan v.2. Technical Report. Contract Number EDET/2216/2012. Limpopo Department of Economic Development, Environment & Tourism (LEDET) by ECOSOL GIS.
Dobson A, et al. 2006. Habitat loss, trophic collapse, and the decline of ecosystem services. Ecology 87: 1915–1924.
Driver A, Sink KJ, Nel JN, Holness S, van Niekerk L, Daniels F, Jonas Z, Majiedt PA, Harris L, Maze K. 2012. National Biodiversity Assessment 2011: An Assessment of South Africa’s Biodiversity and Ecosystems. Synthesis Report. South African National Biodiversity Institute and Department of Environmental Affairs, Pretoria, South Africa.
Friedmann, Y. and Daly, B. 2004. Red Data Book of the Mammals of South Africa: A Conservation Assessment. CBSG Southern Africa, IUCN SSC Conservation Breeding Specialist Group, Endangered Wildlife Trust, South Africa.
GeoTerraImage. 2015a. 1990–2013/14 South African National Land-Cover Change. DEA/CARDNO SCPF002: Implementation of Land-Use Maps for South Africa. Project Specific Data Report.
GeoTerraImage. 2015b. Quantifying settlement and built-up land use change in South Africa.
Jewitt D, Goodman PS, Erasmus BFN, O’Connor TG, Witkowski ETF. 2015. Systematic land-cover change in KwaZulu-Natal, South Africa: implications for biodiversity. South African Journal of Science 111: 1–9.
Lynch CD. 1994. The mammals of Lesotho. Navorsinge van die Nasionale Museum, Bloemfontein 10: 177–241.
MTPA. 2014. Mpumalanga Biodiversity Sector Plan Handbook. Mpumalanga Tourism & Parks Agency, Mbombela (Nelspruit), South Africa.
Monadjem A. 1998. Distributional patterns and conservation status of mammals of Swaziland, southern Africa. Koedoe 41: 45–59.
Monadjem, A., Taylor, P.J., Denys, C. and Cotterill, F.P.D. 2015. Rodents of Sub-Saharan Africa: A Biogeographic and Taxonomic Synthesis. De Gruyter, Berlin, Germany.
Mullin SK, Pillay N, Taylor PJ, Campbell G. 2002. Genetic and morphometric variation in populations of South African Dasymys incomtus incomtus (Rodentia, Murinae). Mammalia 66: 381–404.
Mullin SK, Pillay N, Taylor PJ. 2005. The distribution of the water rat Dasymys (Muridae) in Africa: a review. South African Journal of Science 101: 117–224.
Mullin SK, Taylor PJ, Pillay N. 2004. Skull size and shape of Dasymys (Rodentia, Muridae) from sub-Saharan Africa. Mammalia 68: 185–220.
Mullin SK. 2003. Morphometric variation in the genus Dasymys (Rodentia: Muridae). Ph.D Thesis. University of the Witwatersrand.
Nel JL et al. 2011. Technical Report for the National Freshwater Ecosystem Priority Areas project. Water Research Commission, Pretoria, South Africa.
Nel JL, Roux DJ, Maree G, Kleynhans CJ, Moolman J, Reyers B, Rouget M, Cowling RM. 2007. Rivers in peril inside and outside protected areas: a systematic approach to conservation assessment of river ecosystems. Diversity and Distributions 13: 341-352.
Pence GQK. 2012. Contribution of C.A.P.E. Business and Biodiversity Initiatives to conservation of critical biodiversity, landscape connectivity and ecological support areas: Postbaseline assessment (2010). A Green Choice Alliance project report. Conservation South Africa, Kirstenbosch, South Africa.
Pence GQK. 2014. Western Cape Biodiversity Framework 2014 status update: Critical Biodiversity Areas of the Western Cape. Unpublished CapeNature project report, Cape Town, South Africa.
Pillay N. 2003. Reproductive biology of a rare African rodent, the water rat, Dasymys incomtus. Journal of Mammalogy 84: 505–512.
Power RJ. 2014. The Distribution and Status of Mammals in the North West Province. Department of Economic Development, Environment, Conservation & Tourism, North West Provincial Government, Mahikeng, South Africa.
Skinner J.D. and Chimimba C.T. 2005. The Mammals of the Southern African Subregion. Cambridge University Press, Cambridge, UK.
Skowno, A.L., Poole, C.J., Raimondo, D.C., Sink, K.J., Van Deventer, H., Van Niekerk, L., Harris, L.R., Smith- Adao, L.B., Tolley, K.A., Zengeya, T.A., Foden, W.B., Midgley, G.F. & Driver, A. 2019. National Biodiversity Assessment 2018: The status of South Africa’s ecosystems and biodiversity. Synthesis Report. South African National Biodiversity Institute, an entity of the Department of Environment, Forestry and Fisheries, Pretoria. pp. 1–214.
Skowno, A.L. 2020. Land cover derived terrestrial habitat change map for South Africa (1990-2018). National Biodiversity Assessment: Technical Report. South African National Biodiversity Institute, Pretoria, South Africa. http://hdl.handle.net/20.500.12143/6935